MAG OptiAI

Operational AI Quickstart

Anomaly Detection visual quickstart

Stage a time-series dataset, choose the detector path, run anomaly scoring, and review flagged points and result interpretation.

Visual walkthrough

Follow the workflow step by step, using the screenshots where available and the concise action notes throughout.

Before you start

Use a contextual sample only when you have context features to validate.
Use the starter sample first when you want a quick end-to-end anomaly check.

Step 1

Open the workspace

Start in the Anomaly Detection workspace and review the step shell for scenario, configure, run, and results.


Anomaly Detection workspace overview showing the project-backed lifecycle steps.
The Anomaly Detection workspace begins with project scope, then moves through data, detector, scoring, and results.

Step 2

Stage the anomaly dataset

Upload a time-series CSV or load the starter sample that matches your detector path.
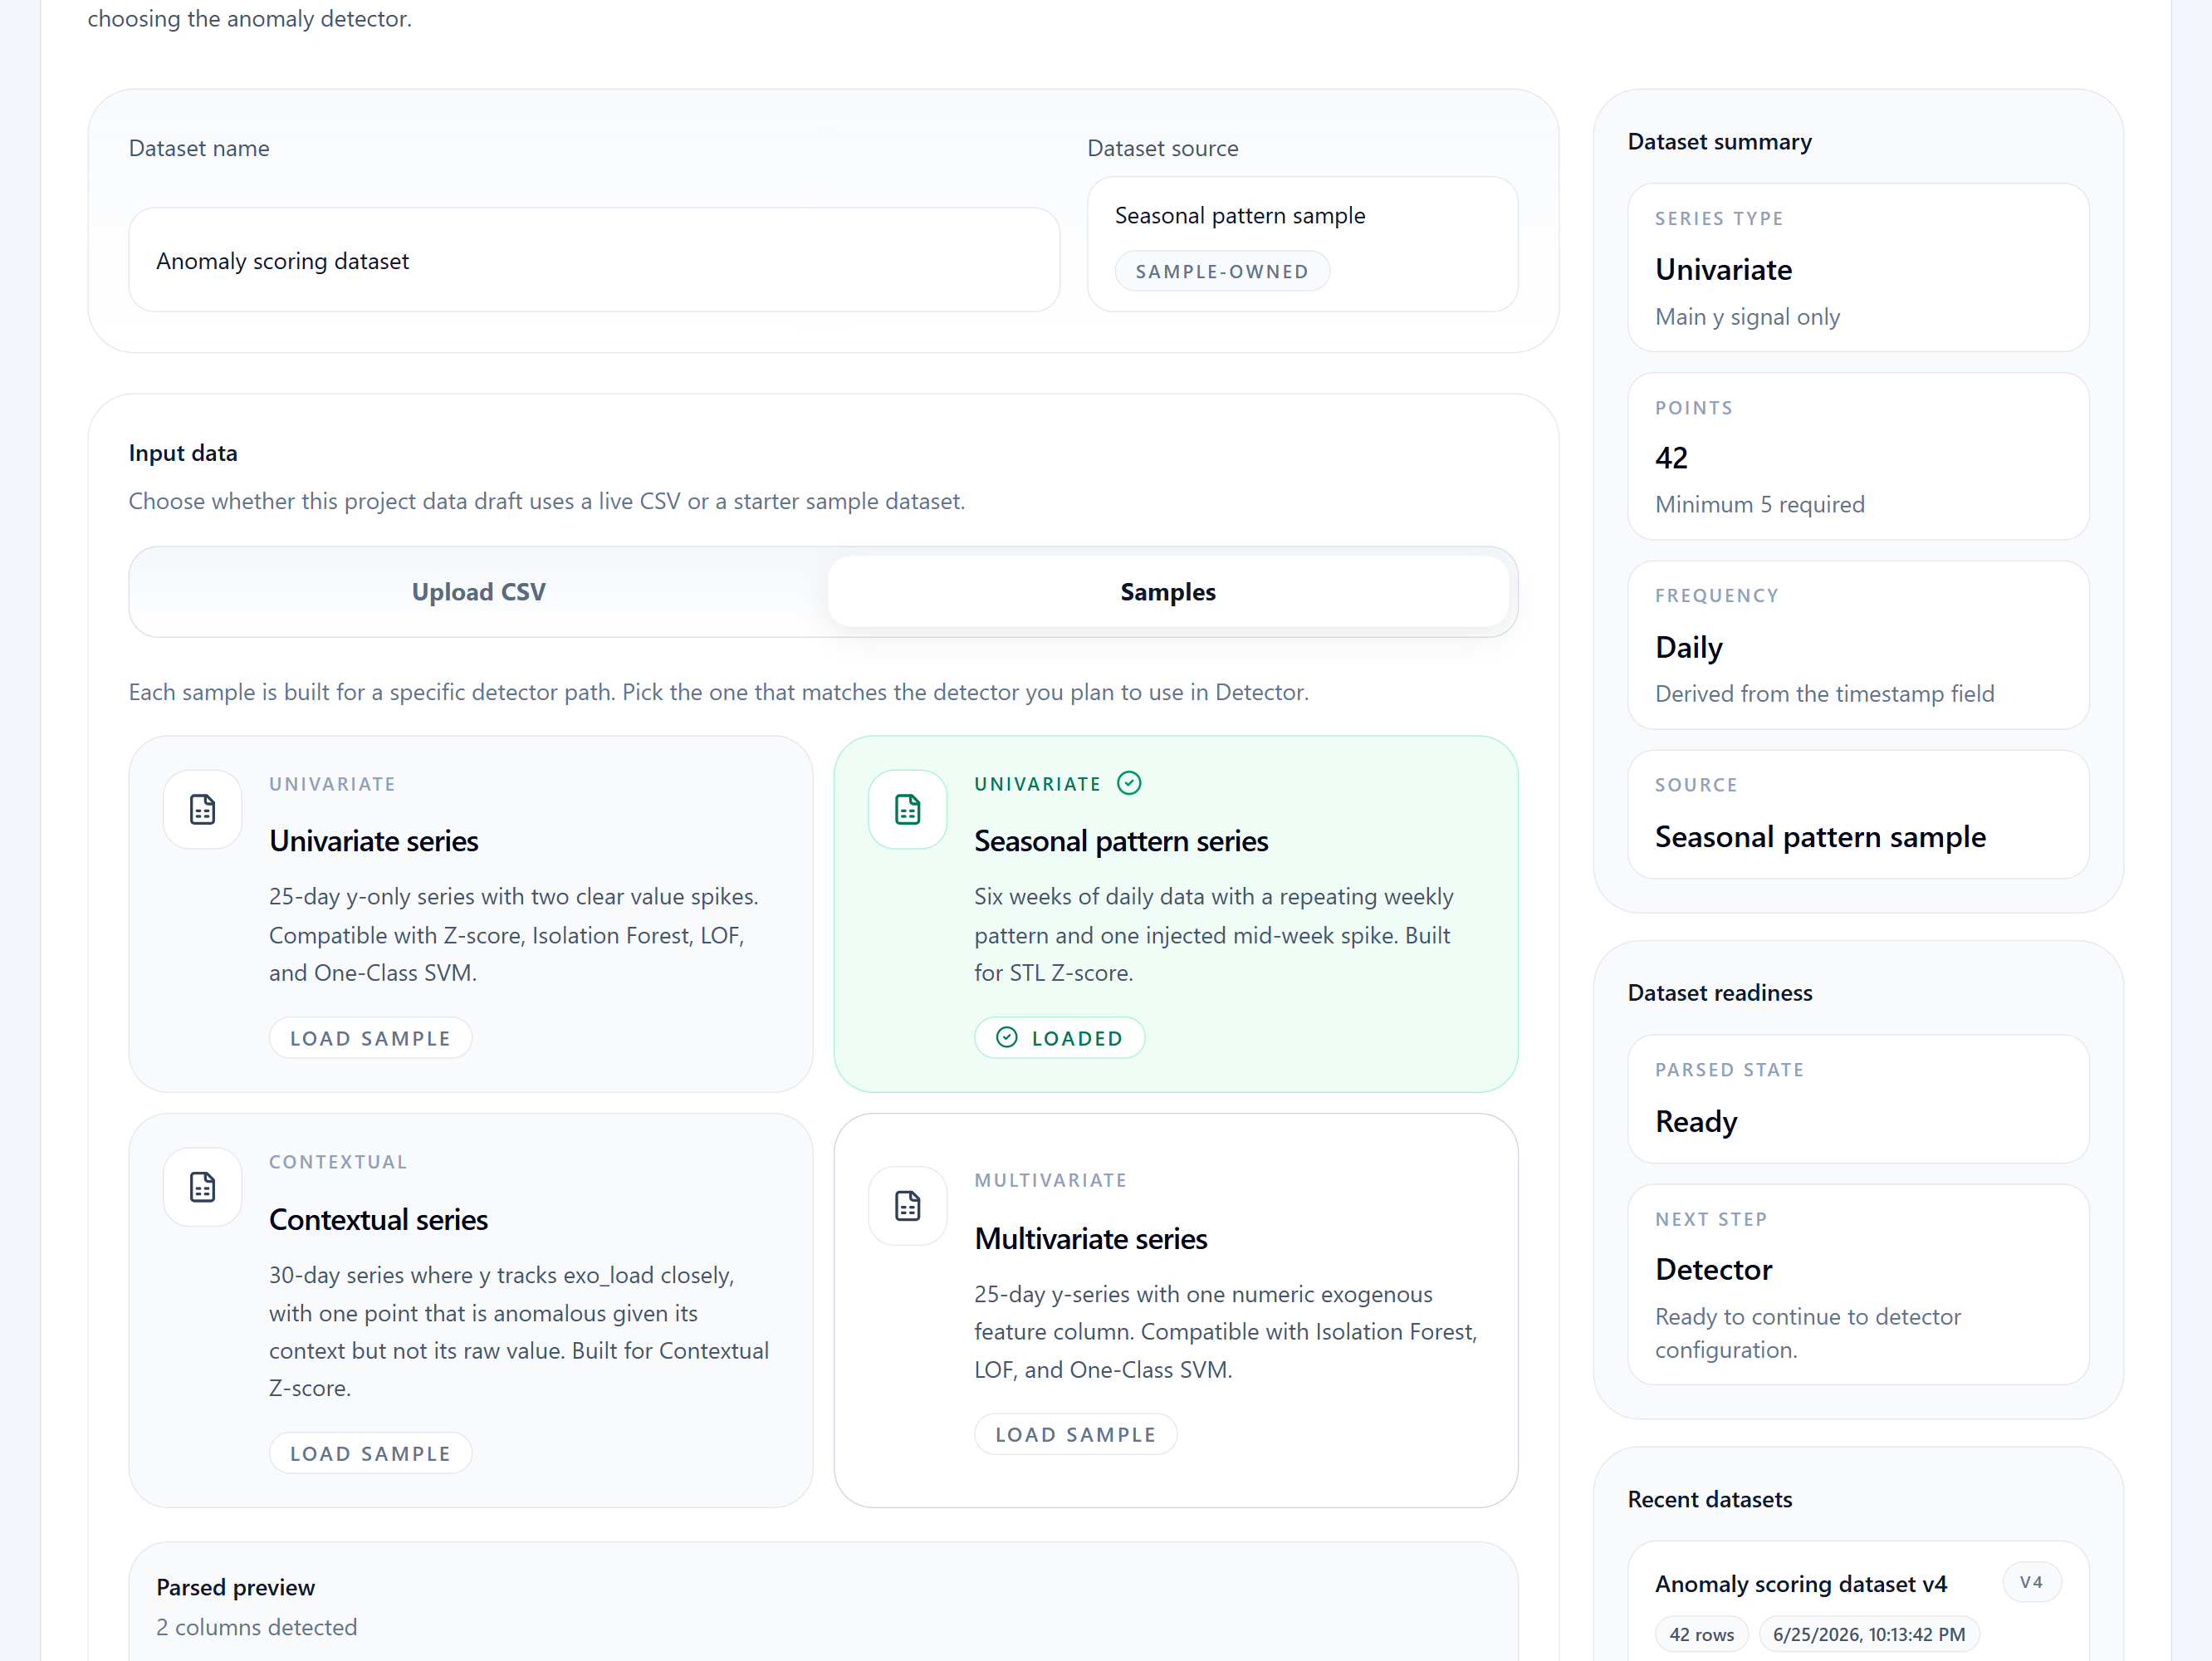
Anomaly data step with sample loading and time-series readiness details.
Users stage time-series rows before choosing the detector path and scoring anomalies.

Step 3

Choose the detector path

Select the anomaly model and any detector-specific settings before running.

Anomaly detector step showing model path and detector-specific controls.
The detector step keeps model selection and scoring assumptions visible before running anomaly detection.

Step 4

Run anomaly scoring

Use the run step when the dataset and detector settings both validate.
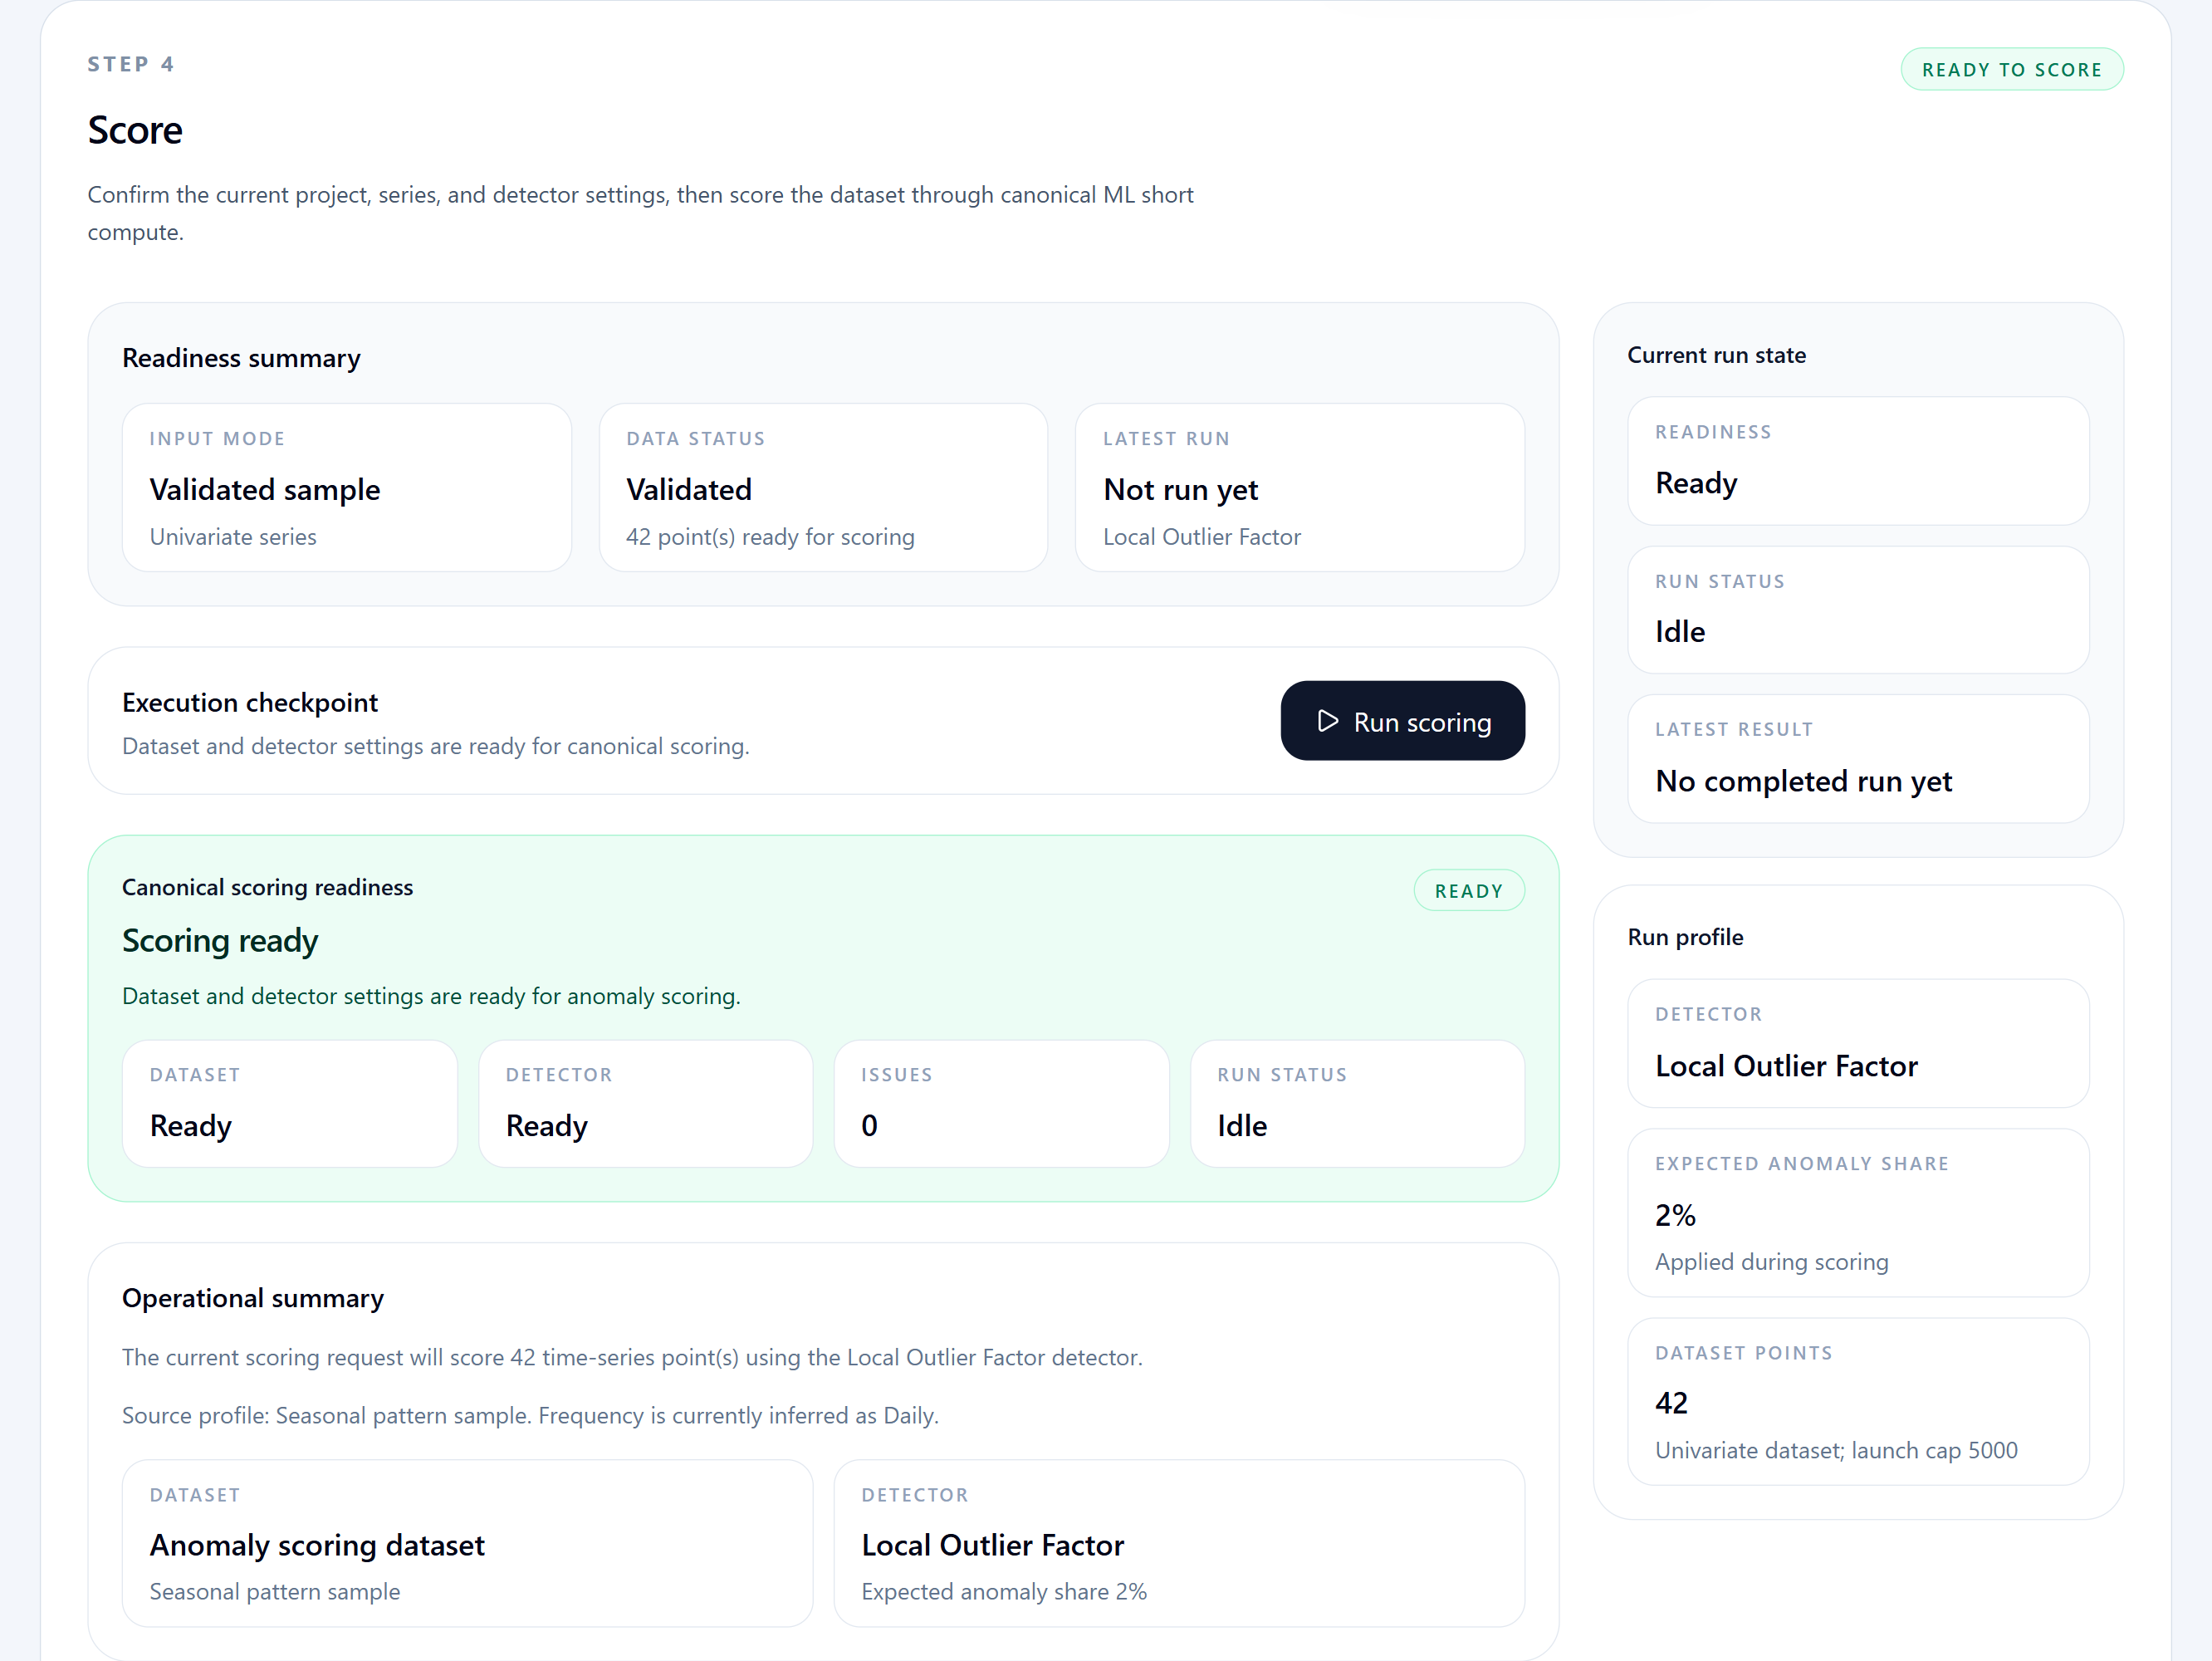
Anomaly score step showing execution readiness for the staged series.
The score step launches anomaly detection once the data and detector configuration validate.

Step 5

Review flagged points

Inspect the anomaly chart, threshold, and explanation output after scoring completes.
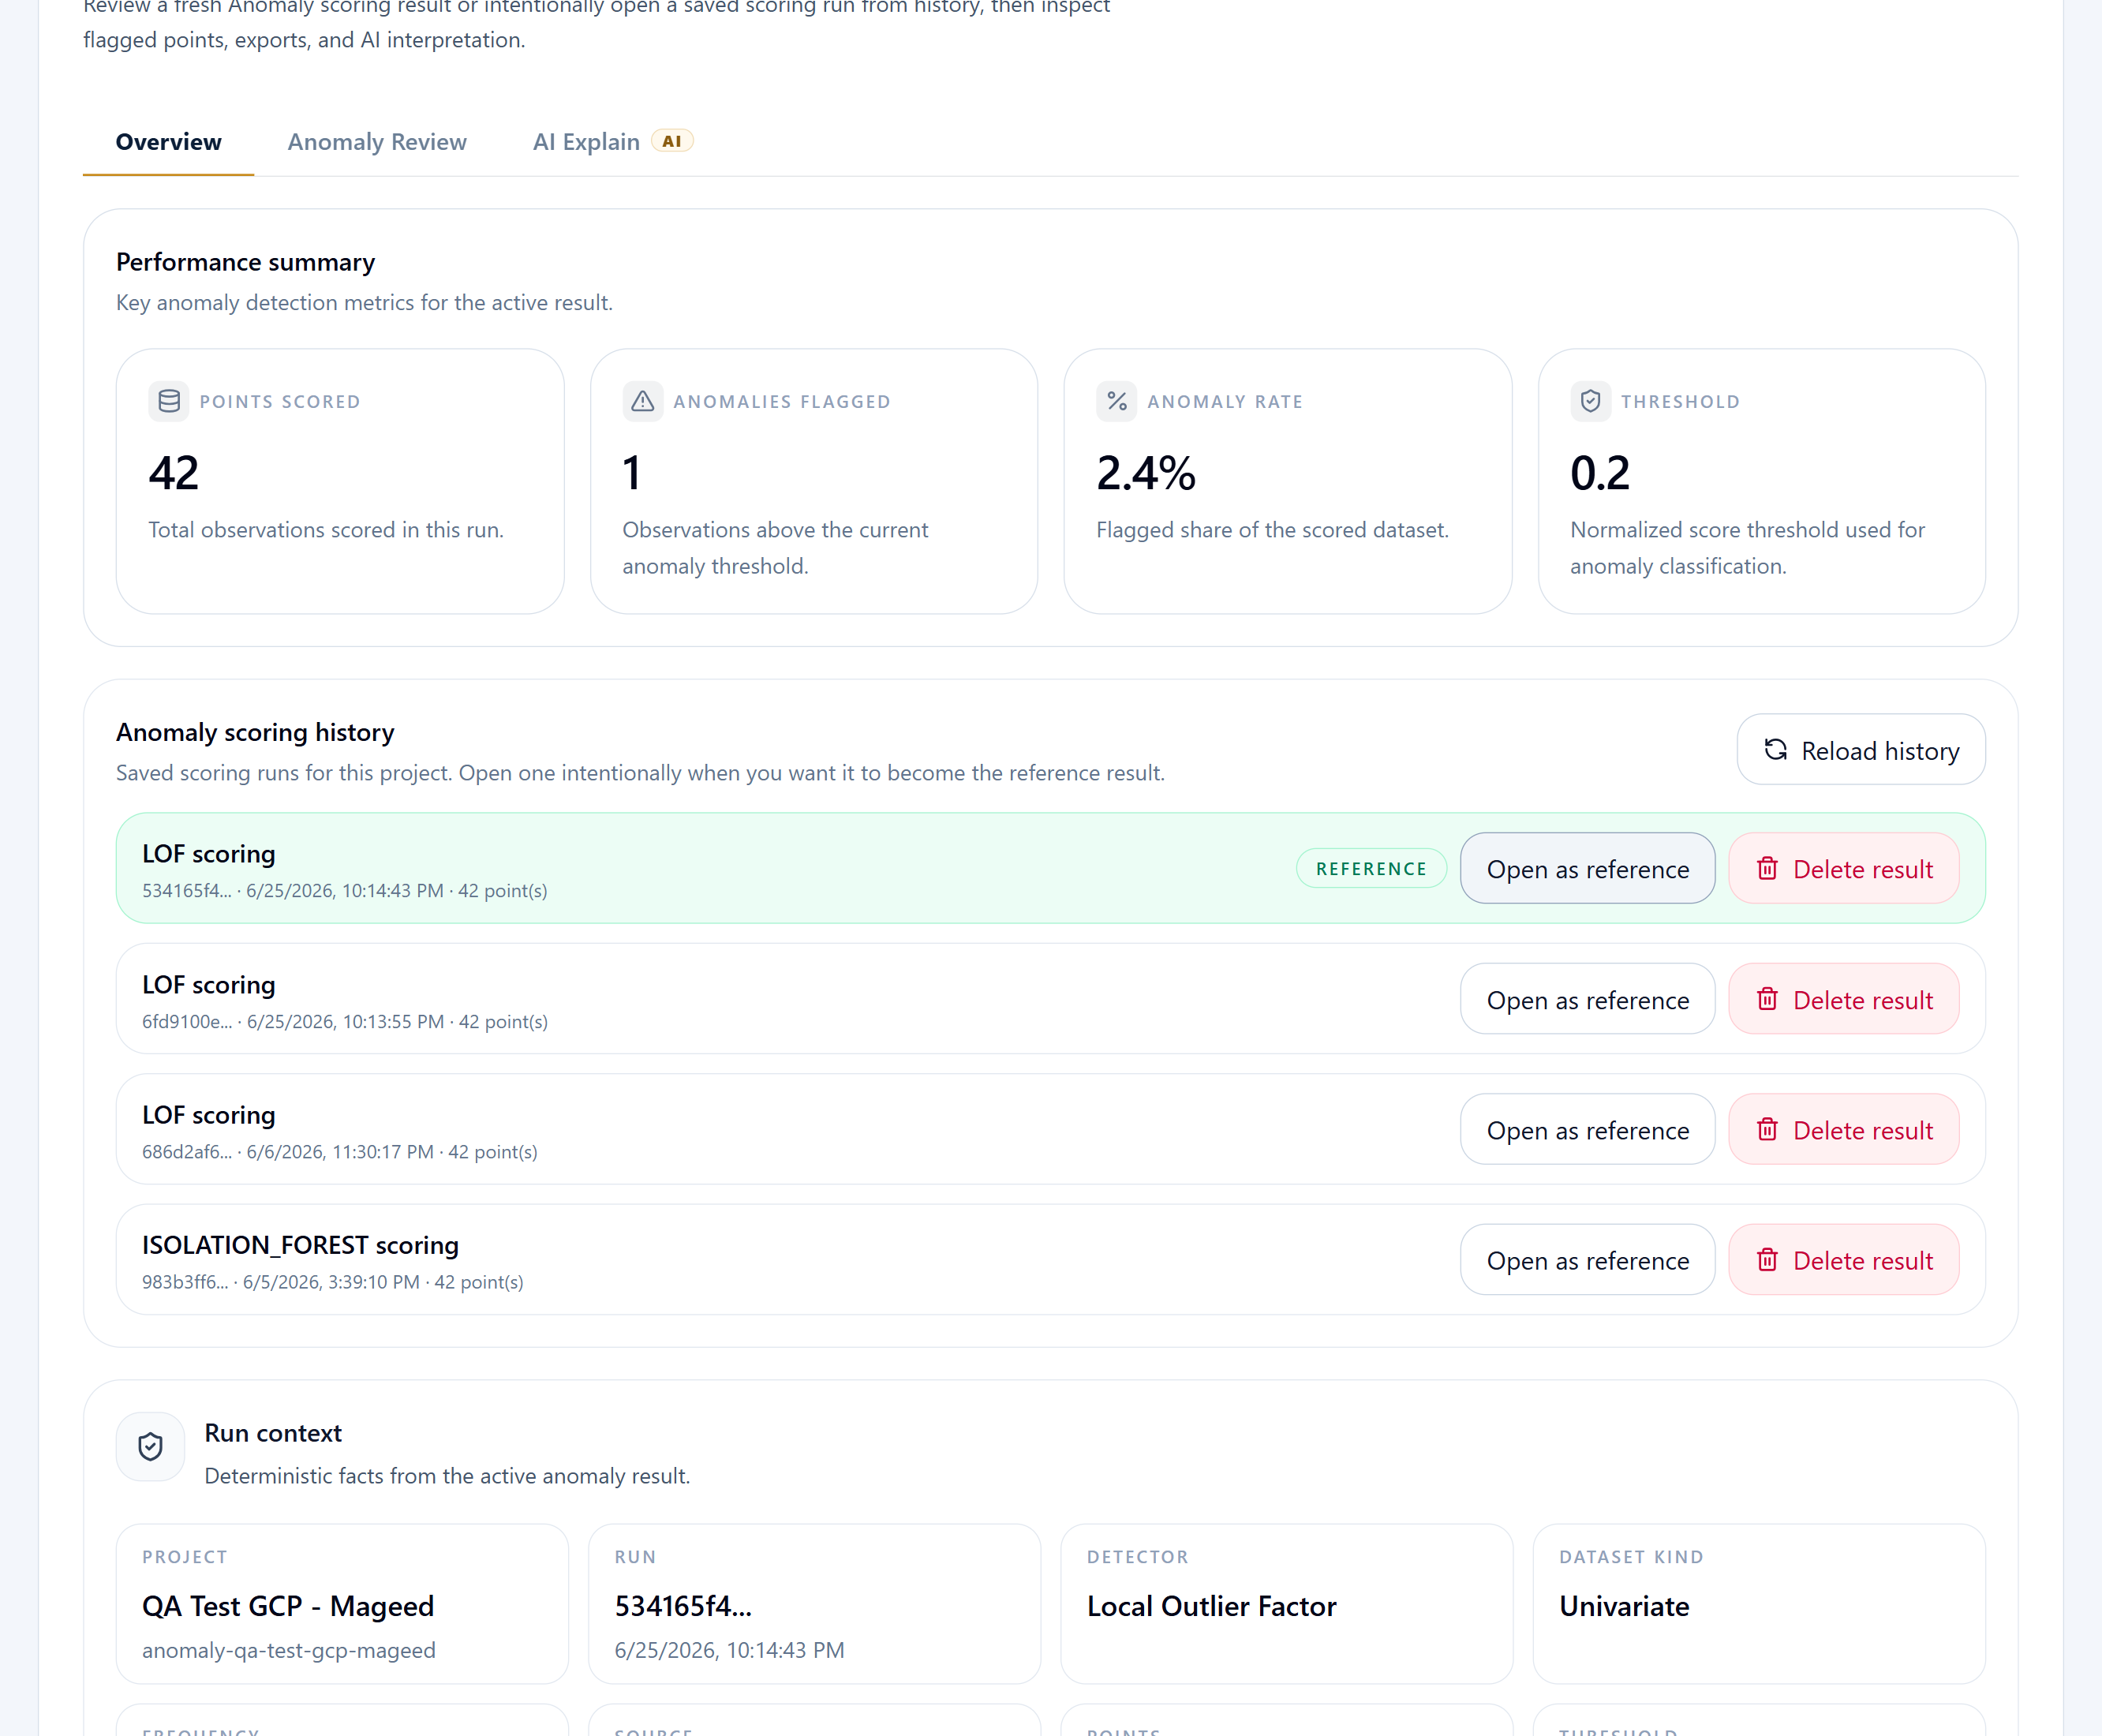
Anomaly results showing flagged points, threshold context, and interpretation surfaces.
Results surface scored anomaly points, run context, and explanation support after a successful scoring run.

Expected outputs

Scored anomaly points and returned threshold
Anomaly chart with flagged events
Run context and explanation support for the scored result

Common mistakes

Using a dataset shape that does not match the selected detector path
Skipping validation after swapping between upload and sample modes
Interpreting stale anomaly results after changing the detector or dataset

Next steps

Move from walkthrough to the right working page

Open the live workspace when you are ready to execute, or use the related product, use case, and spec pages when you need more context first.

Open workspace

Move straight into the live Pro Console workspace.

Product page

Review the product overview and launch positioning.

Input spec

Confirm the required data shape before upload.

Use case

See where this workflow fits operationally.

Pricing

Check plan and rollout options.

Navigate

Keep this quickstart connected to the resource library

Return to the quickstart index for another product walkthrough, or go back to the resource hub for use cases, input specs, and how-to guides.