

Executive Summary
Anomaly Detection turned a noisy exception queue into a focused investigation workflow.
A fulfillment operations team needed to monitor a daily exception queue across more than a year of operating history. The queue was affected by order volume, carrier delays, staffing gaps, weather, promotions, weekends, and calendar seasonality.
The team did not need a persisted training lifecycle. Anomaly Detection is a scoring workflow: load a time series, choose the detector, score the current dataset, inspect flagged points, and use AI Explain to interpret the result.
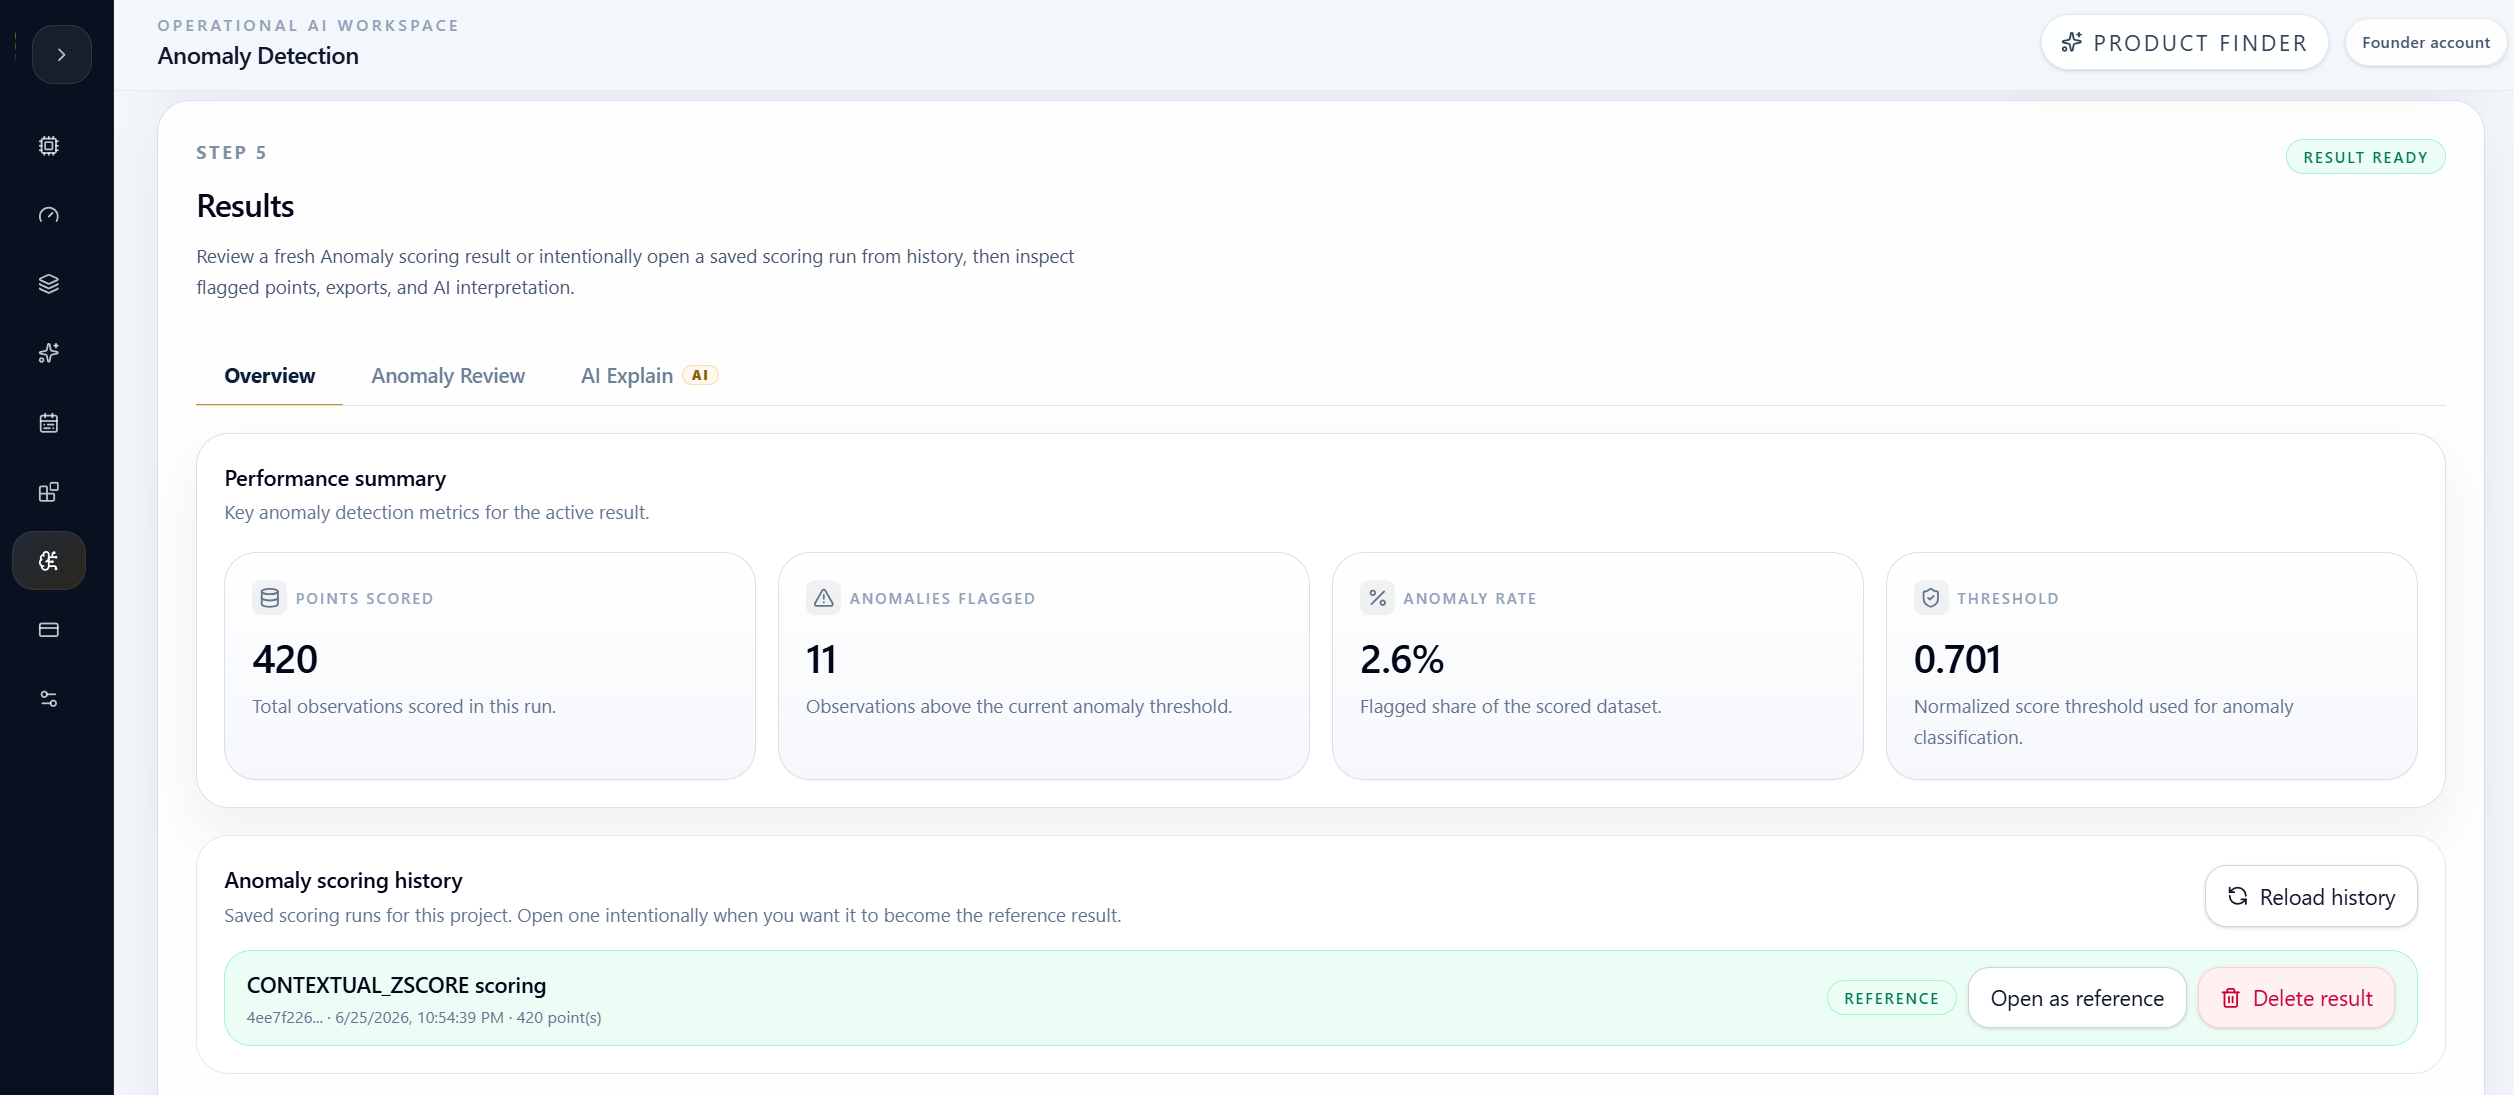
The case used a 420-day multivariate dataset and selected Contextual Z-score with a 2.5% expected anomaly share. The detector scored all 420 points, flagged 11 anomalies, and returned a threshold of 0.701.
The strongest pattern was a January 7-9, 2026 cluster where observed exception volume exceeded the model-predicted baseline even after accounting for operational drivers. AI Explain translated that signal into an investigation plan without inventing a root cause.
History
420 days
Detector
Contextual Z-score
Flagged
11 dates
Core capabilities exercised
- Project-backed Anomaly Detection workspace for scoring operational time-series data.
- CSV upload path that distinguishes univariate, contextual, and multivariate detector options.
- Contextual Z-score detector that fits an expected baseline from exogenous features.
- Configurable expected anomaly share so teams can control review volume.
- Saved scoring history with reference-run behavior for reopening prior anomaly results.
- Anomaly Review chart with observed value, expected baseline, anomaly points, and threshold.
- AI Explain grounded in returned scores, expected baseline, detector metadata, and context features.
Context
The exception queue was seasonal, driver-aware, and noisy.
Exception queues are noisy. A high queue count can be normal on a promotion day, a bad-weather day, or a weekend with higher carrier delays. A lower value can also be suspicious when the operating context predicts more exceptions than the system reports.
That is why this case uses a driver-aware dataset instead of a simple single-column spike example. The input includes the target exception count plus order volume, carrier delay percentage, staffing gap, weather index, promotion flag, weekend flag, and encoded day-of-week and month signals.
The business question is practical: which dates should operations investigate first, and which apparent spikes are actually explainable by the conditions around them?
Signal structure
Weekly pattern
Calendar features captured day-of-week behavior.
Operational pressure
Order volume, delay, staffing, and weather influenced expected load.
Business events
Promotion and weekend flags helped avoid false alerts.
Abnormal windows
High and low deviations remained visible after context.
Challenge
Static thresholds could not separate normal pressure from abnormal behavior.
Static thresholds are weak for this workflow. If a team uses one fixed exception count as the alert boundary, it risks over-alerting during expected demand pressure and under-alerting when the queue is abnormal relative to the context.
The product therefore had to support detector choice, contextual scoring, threshold control, chart review, flagged-point review, and explanation. It also had to stay honest: anomaly detection can prioritize investigation, but it should not claim hidden root causes from a score alone.
This makes the case different from a toy anomaly demo. The dataset has weekly seasonality, calendar shape, operational drivers, high anomalies, low anomalies, and clustered events.
What the detector needed to handle
- Score a daily operational series without requiring labels or a model-training lifecycle.
- Account for predictable context such as order volume, promotions, weekends, and weather.
- Avoid flagging every high-volume promotion period as suspicious.
- Detect both unexpectedly high and unexpectedly low exception counts.
- Expose the expected baseline so operators can understand the deviation.
- Use AI Explain as investigation support, not as automatic root-cause proof.
Data
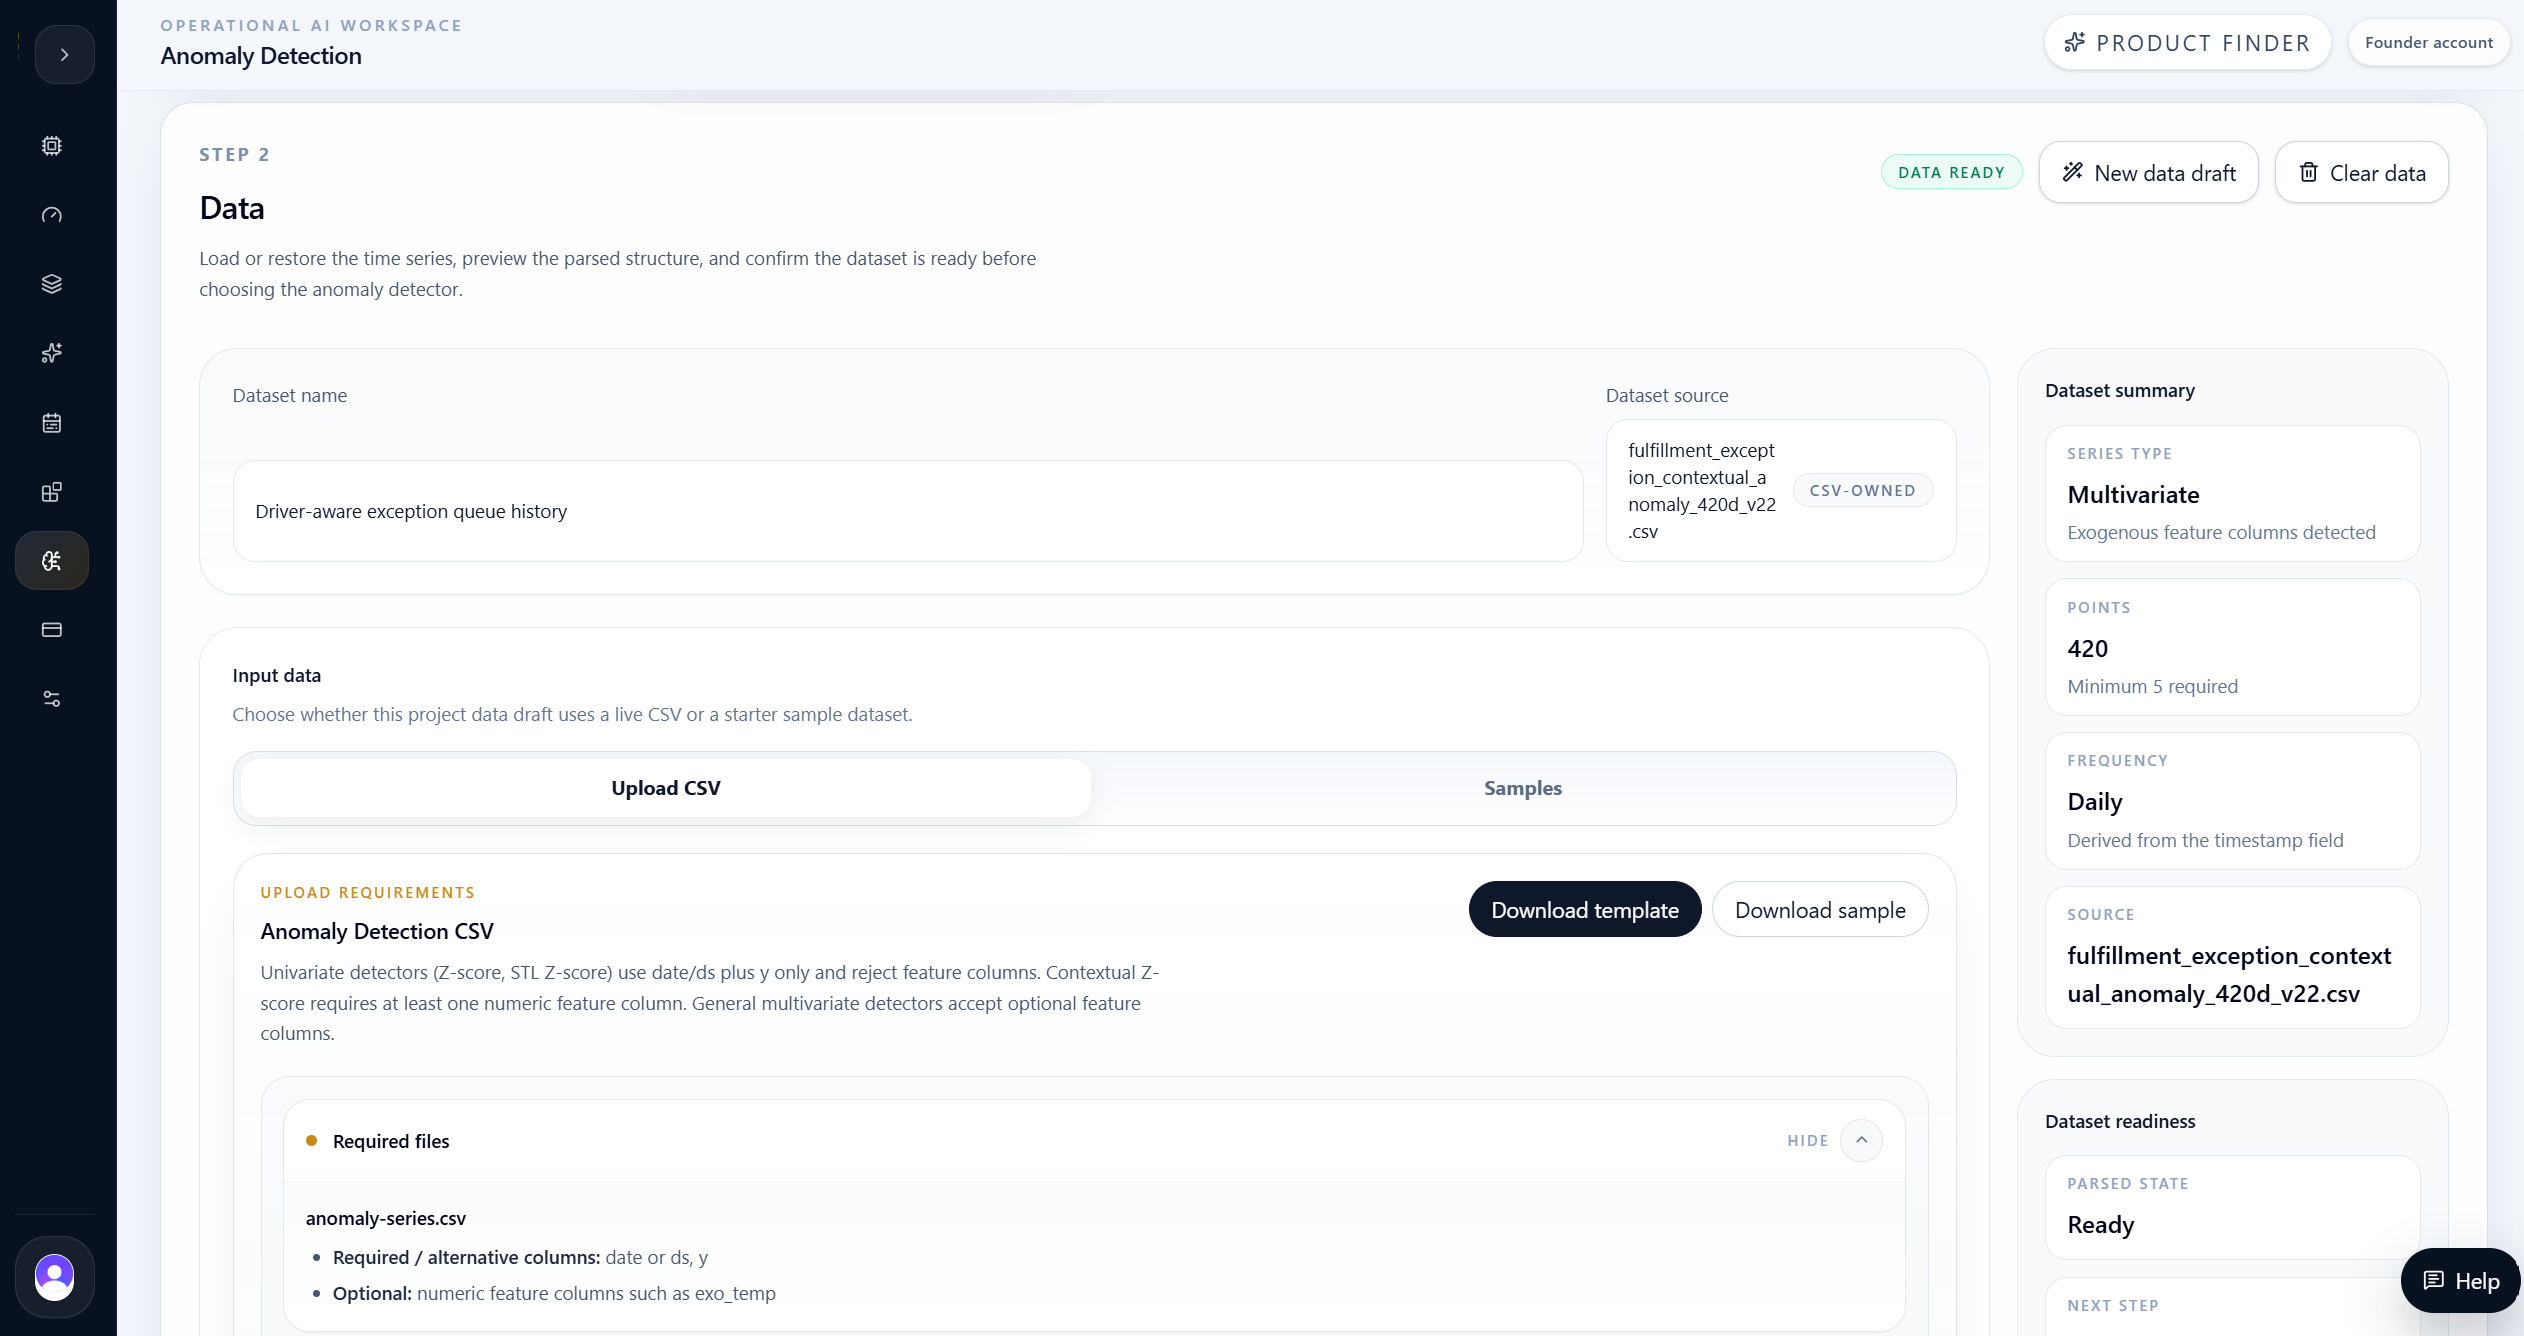
The uploaded file gave the detector context, not just a target column.
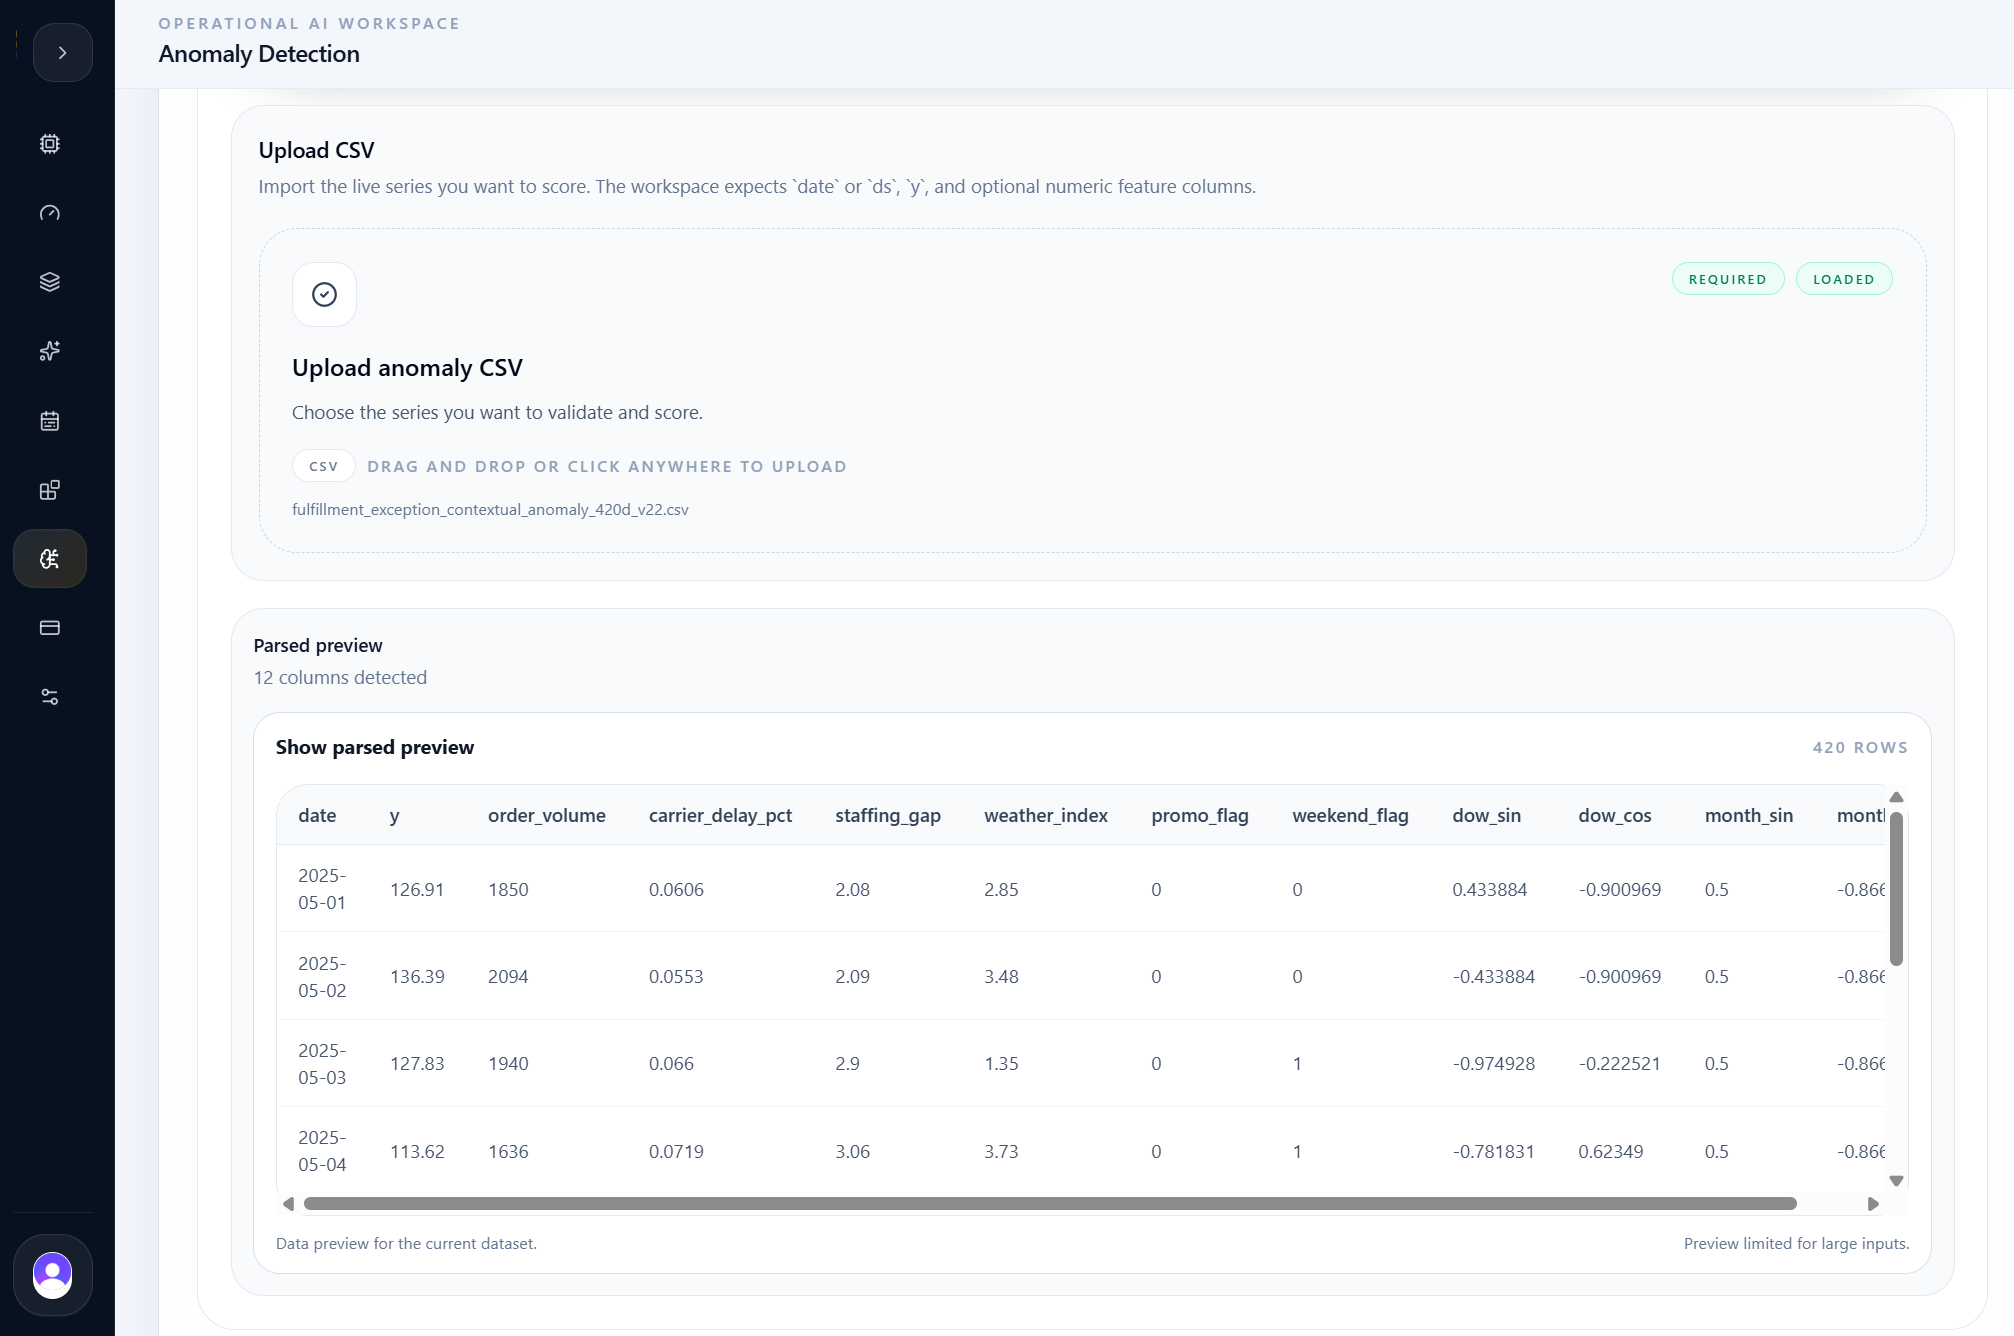
The team uploaded a 420-row daily history for a fulfillment exception queue. The target column was y, representing the exception queue value to monitor.
The file also included 10 numeric context features. Some represented operating pressure directly, such as order volume, carrier delay percentage, staffing gap, weather index, and promotion flag. Others encoded calendar structure, including weekend, day-of-week, and month signals.
That structure matters because a contextual detector can learn what the queue should look like under the current operating conditions, then flag points where the observed value departs from that expected baseline.
Dataset facts
- 420 daily rows from May 2025 through June 2026.
- Target column: y.
- Operational drivers: order volume, carrier delay percentage, staffing gap, weather index, promotion flag.
- Calendar drivers: weekend flag, day-of-week sine and cosine, month sine and cosine.
- Dataset type: multivariate.
- No labeled anomaly target required.
Detector
Contextual Z-score matched the driver-aware monitoring problem.
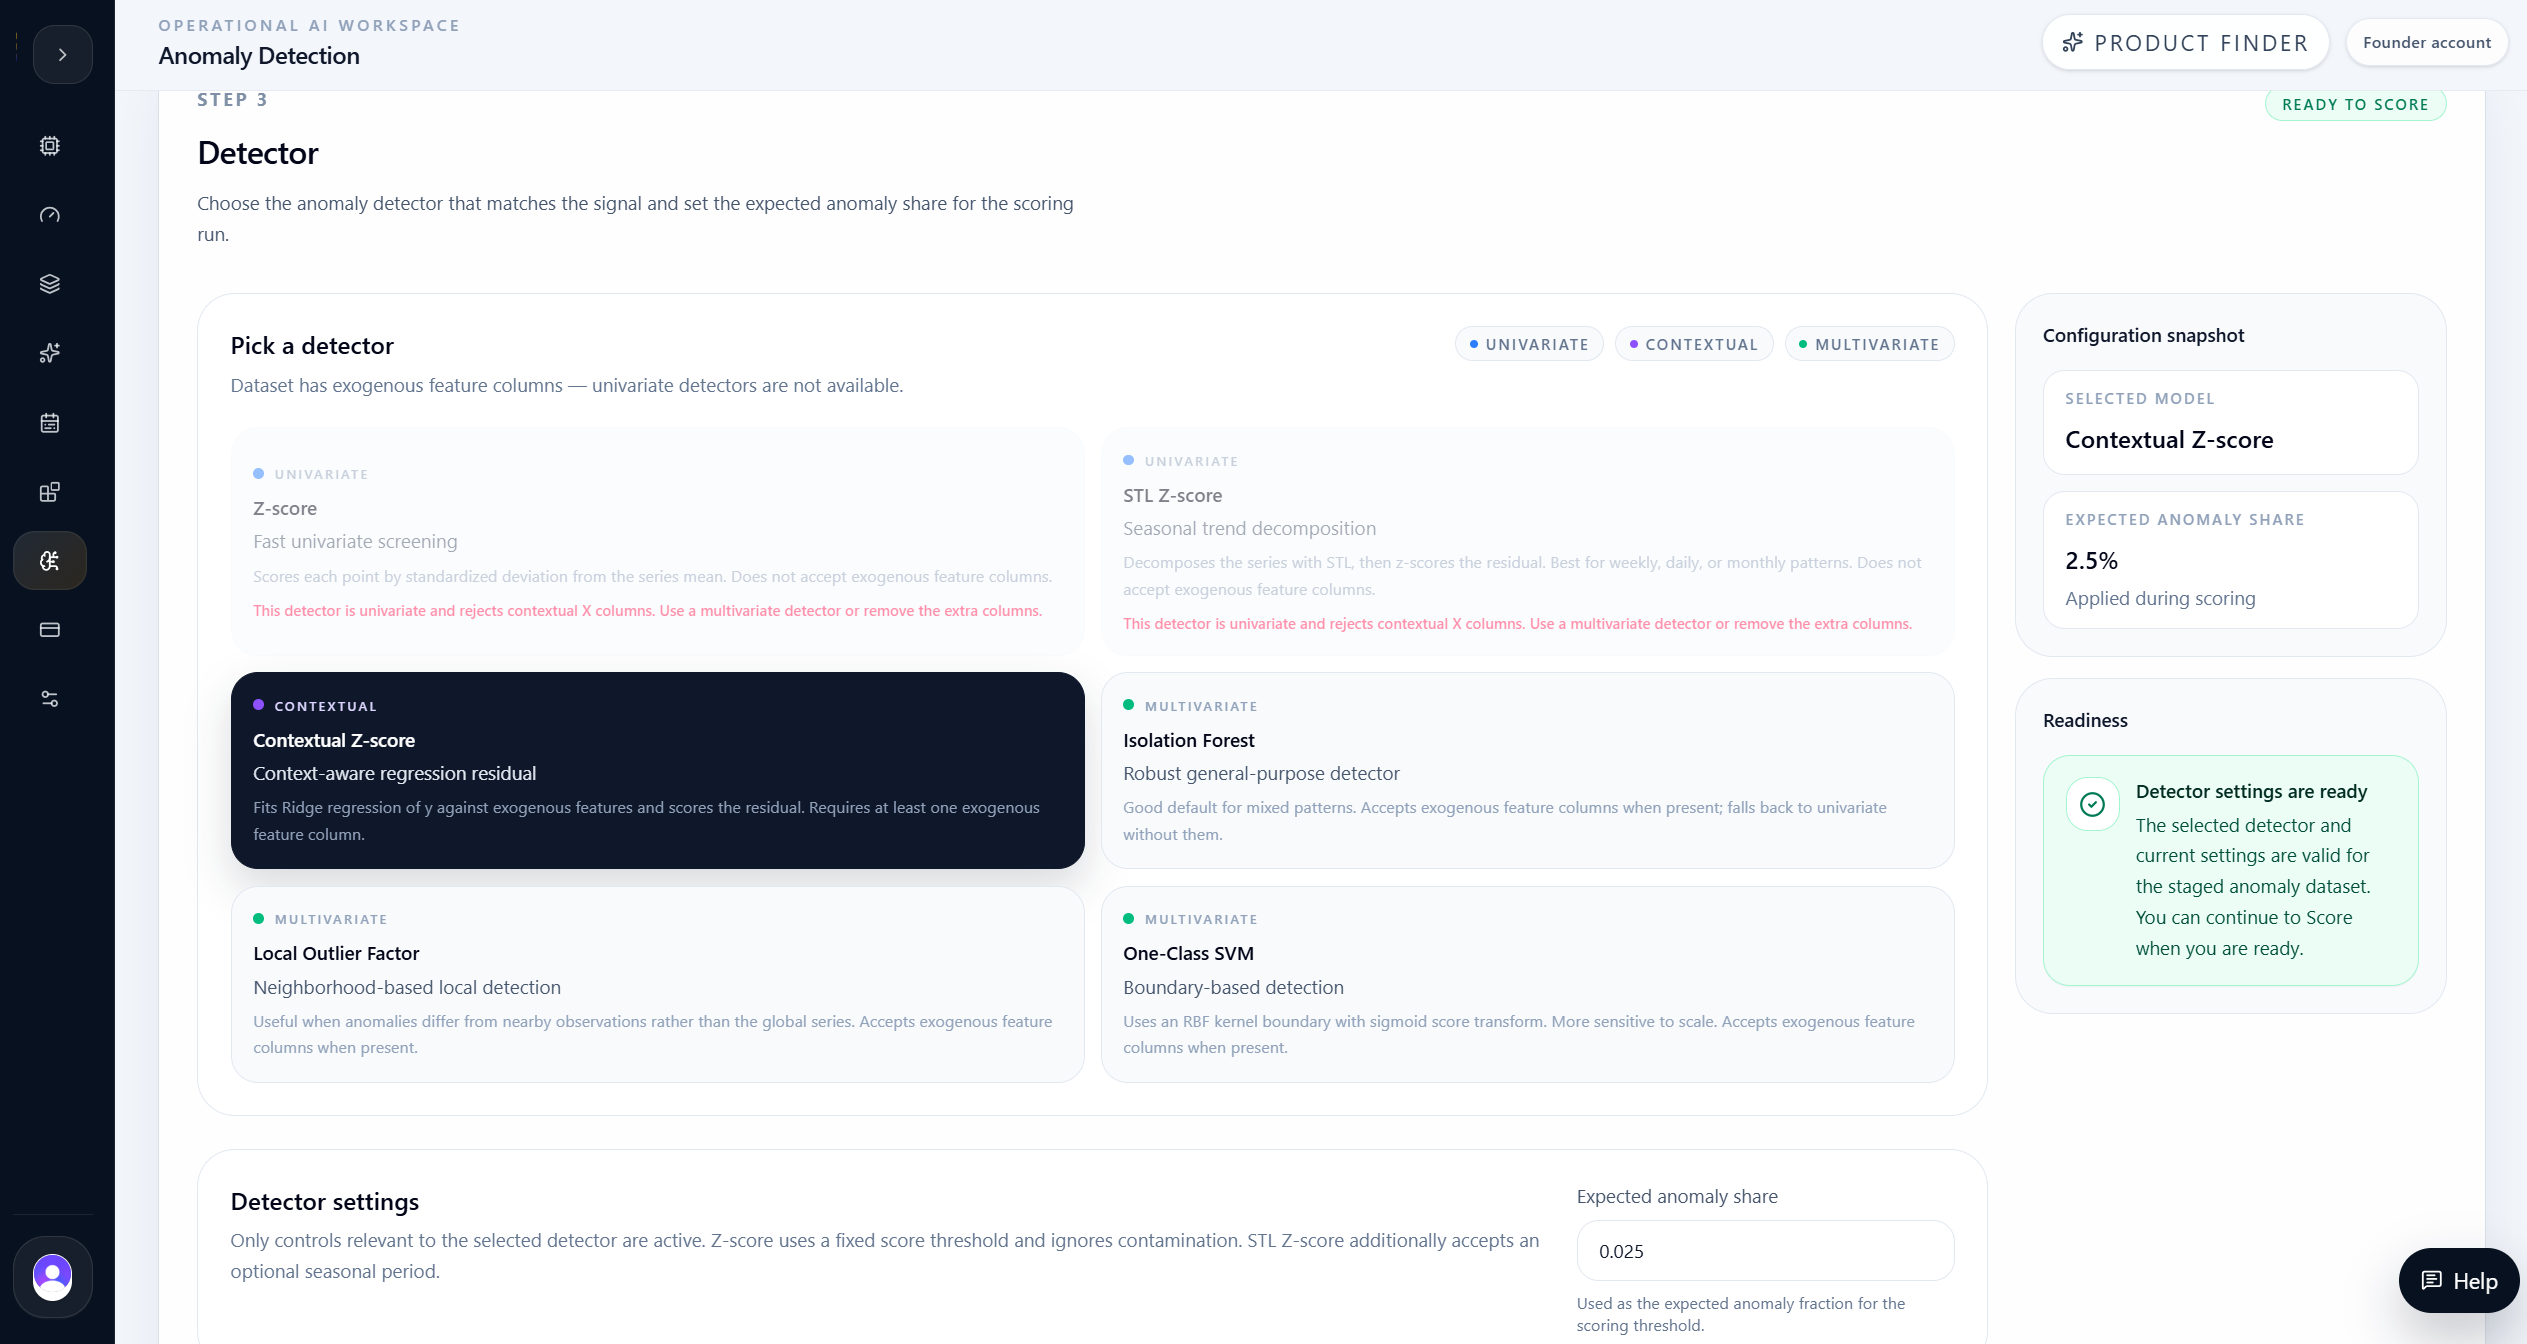
The dataset included exogenous feature columns, so the workspace disabled the univariate detectors for this run and made contextual and multivariate detectors available.
The team selected Contextual Z-score because it is the best fit for this story. It fits a regression-based expected baseline from the context features, then scores the residual: the difference between observed value and expected value.
The expected anomaly share was set to 2.5%. This keeps the review list narrow enough for an operations team while still surfacing a useful set of high-priority investigation dates.
Selected configuration
- Detector: Contextual Z-score.
- Expected anomaly share: 2.5%.
- Context features used: 10.
- Feature expansion degree: 2.
- Expected baseline returned for chart and AI explanation.
- No saved model staging required because this product scores the active dataset directly.
Score
The workflow scored the active dataset directly.
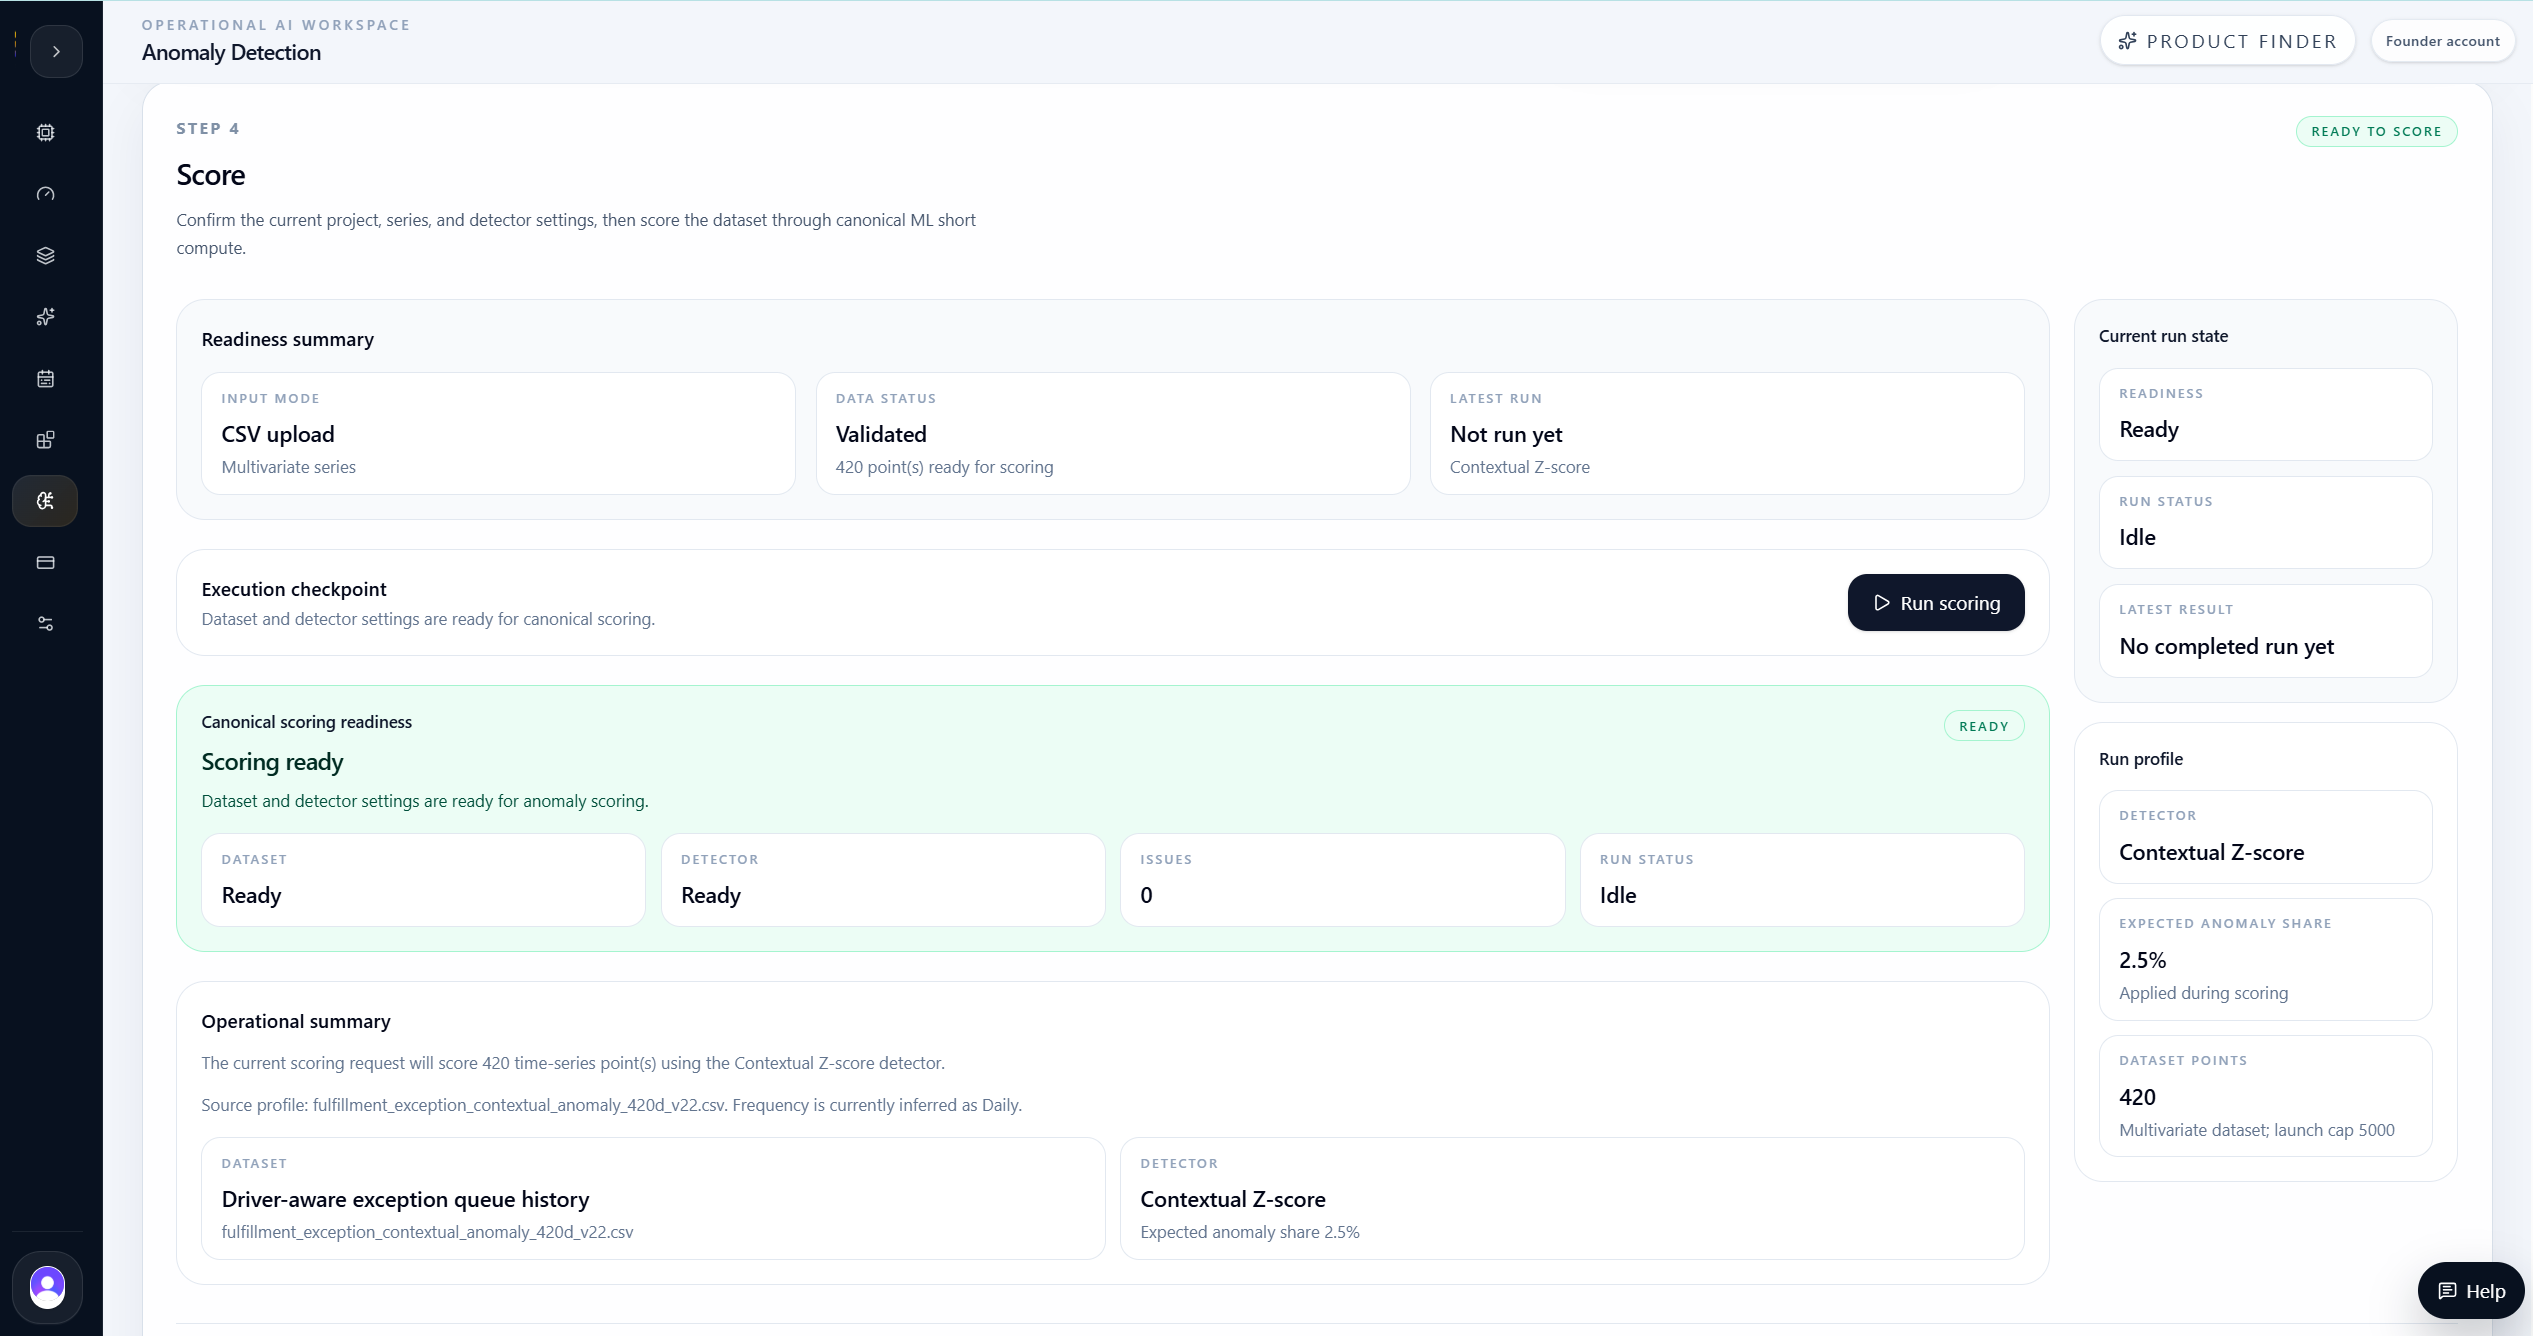
After data validation and detector selection, the scoring step confirmed that the 420-point multivariate dataset and Contextual Z-score settings were ready for canonical scoring.
This step is intentionally simple. Unlike Forecasting or Fraud Detection, Anomaly Detection does not ask the user to train and stage saved model versions. The detector learns the active pattern from the submitted series and returns scores, flags, and context for this scoring run.
Results
The run narrowed 420 days down to 11 investigation points.
The run scored all 420 observations and flagged 11 points as anomalous. The anomaly rate was 2.6%, aligned with the configured 2.5% expected anomaly share. The normalized threshold was 0.701.
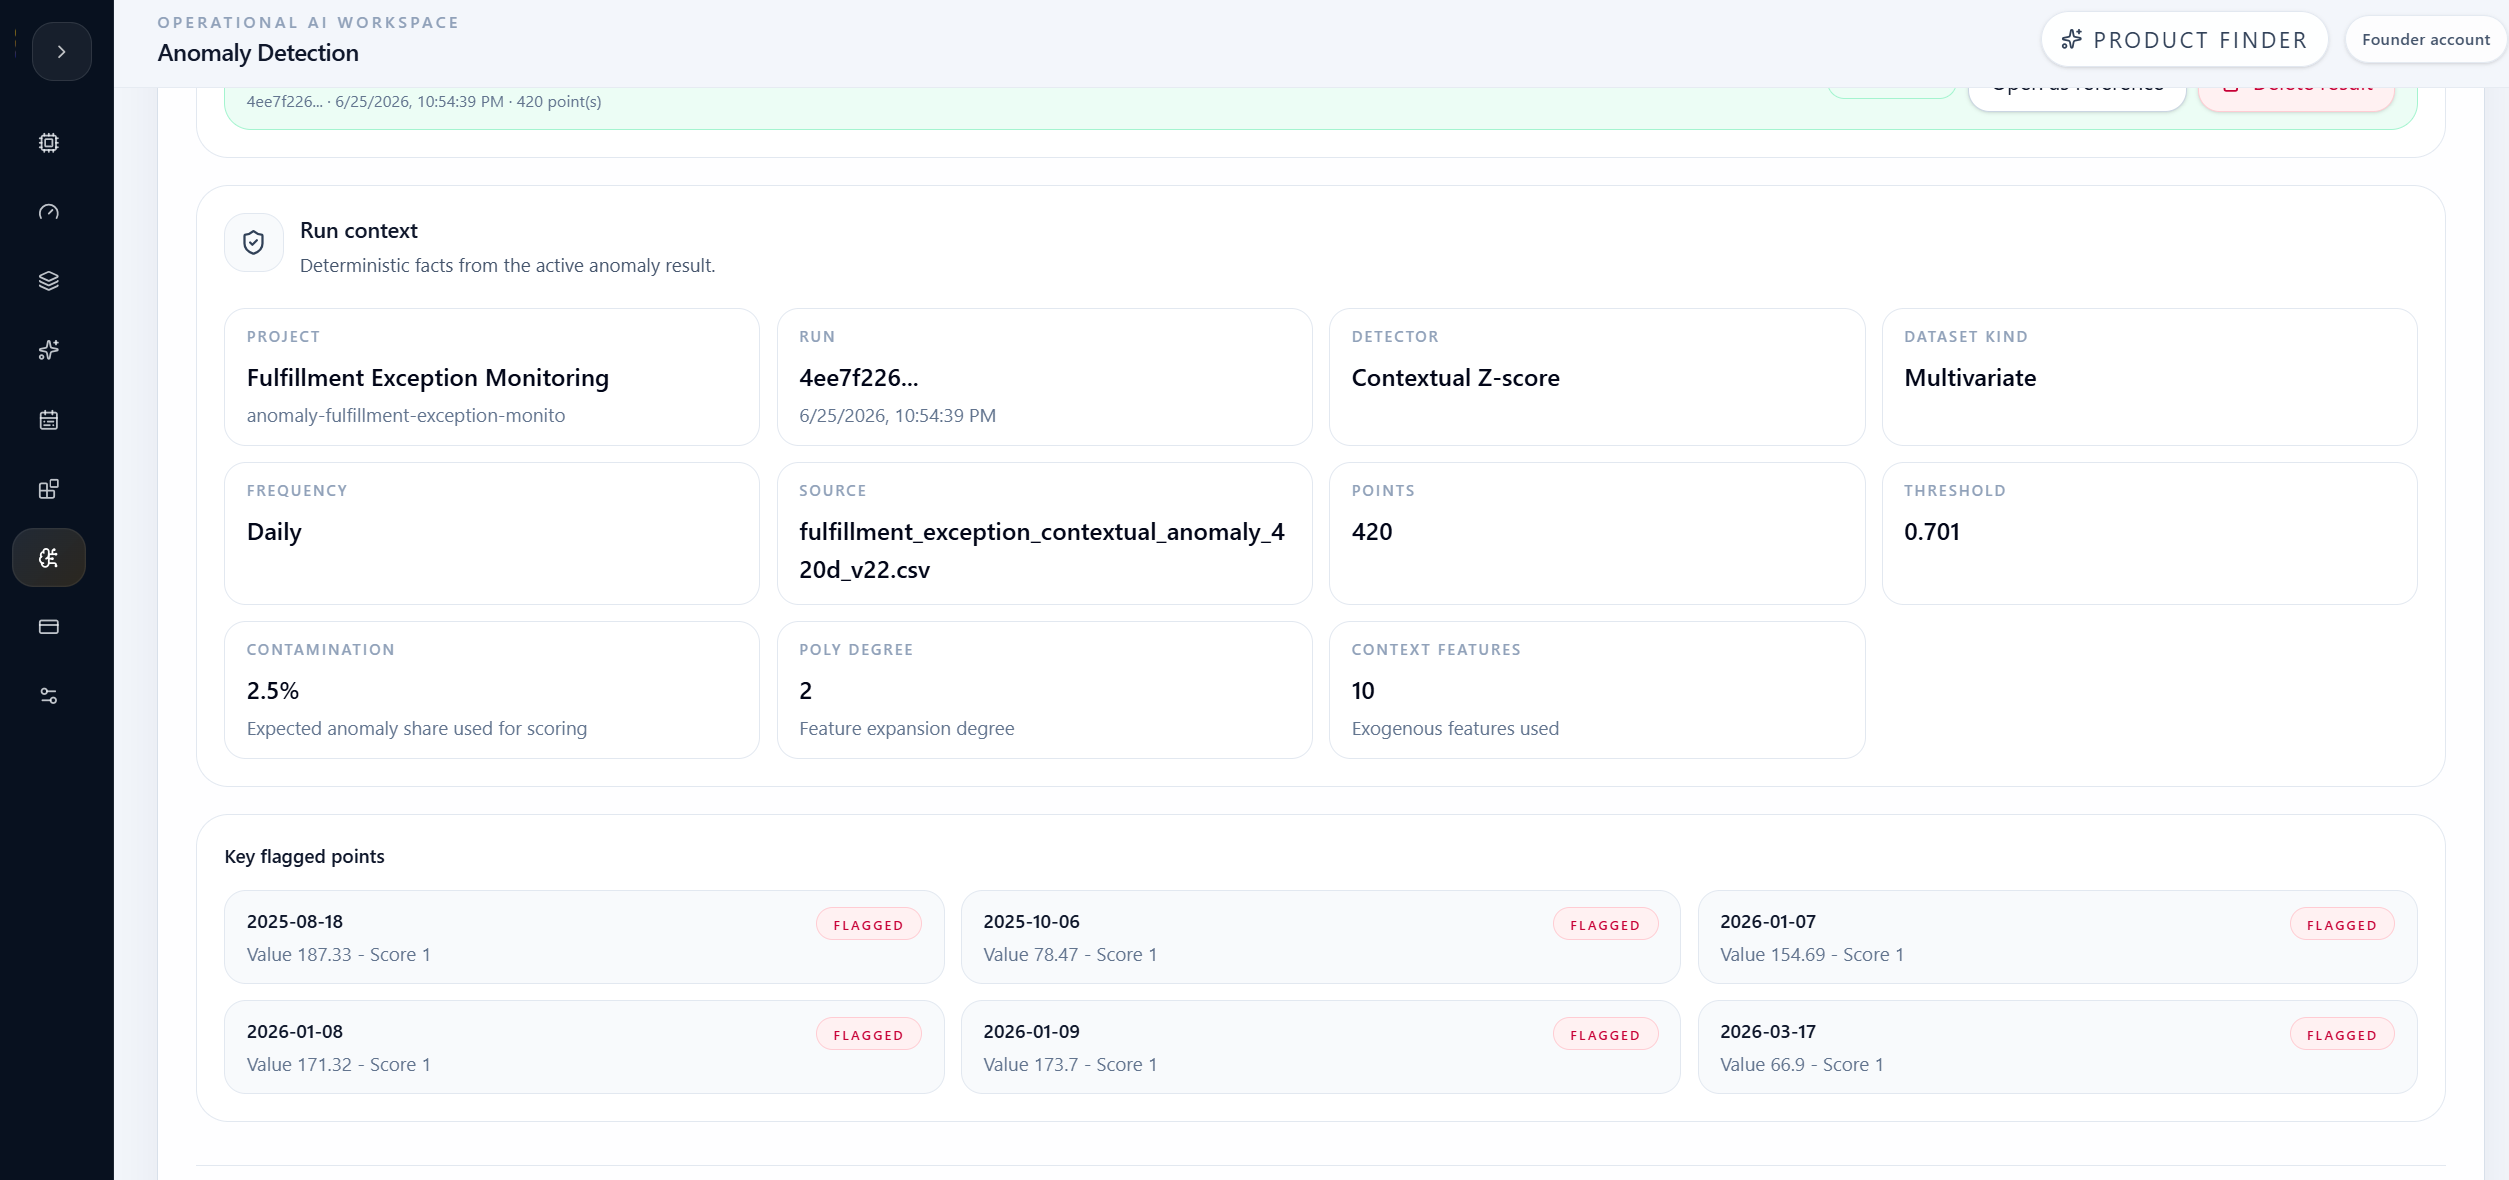
The run context confirmed the important facts: project name, detector, dataset kind, daily frequency, point count, threshold, contamination, polynomial degree, and context-feature count.
The top flagged points included both isolated dates and a sustained January 7-9 cluster. That mix is useful for operations: isolated events may point to one-off disruptions, while a cluster suggests a process window that deserves deeper review.
| Points scored | 420 |
|---|---|
| Anomalies flagged | 11 |
| Anomaly rate | 2.6% |
| Threshold | 0.701 |
| Detector | Contextual Z-score |
| Expected anomaly share | 2.5% |
| Context features | 10 |
| Polynomial degree | 2 |
Review
The review view turned scores into an investigation queue.
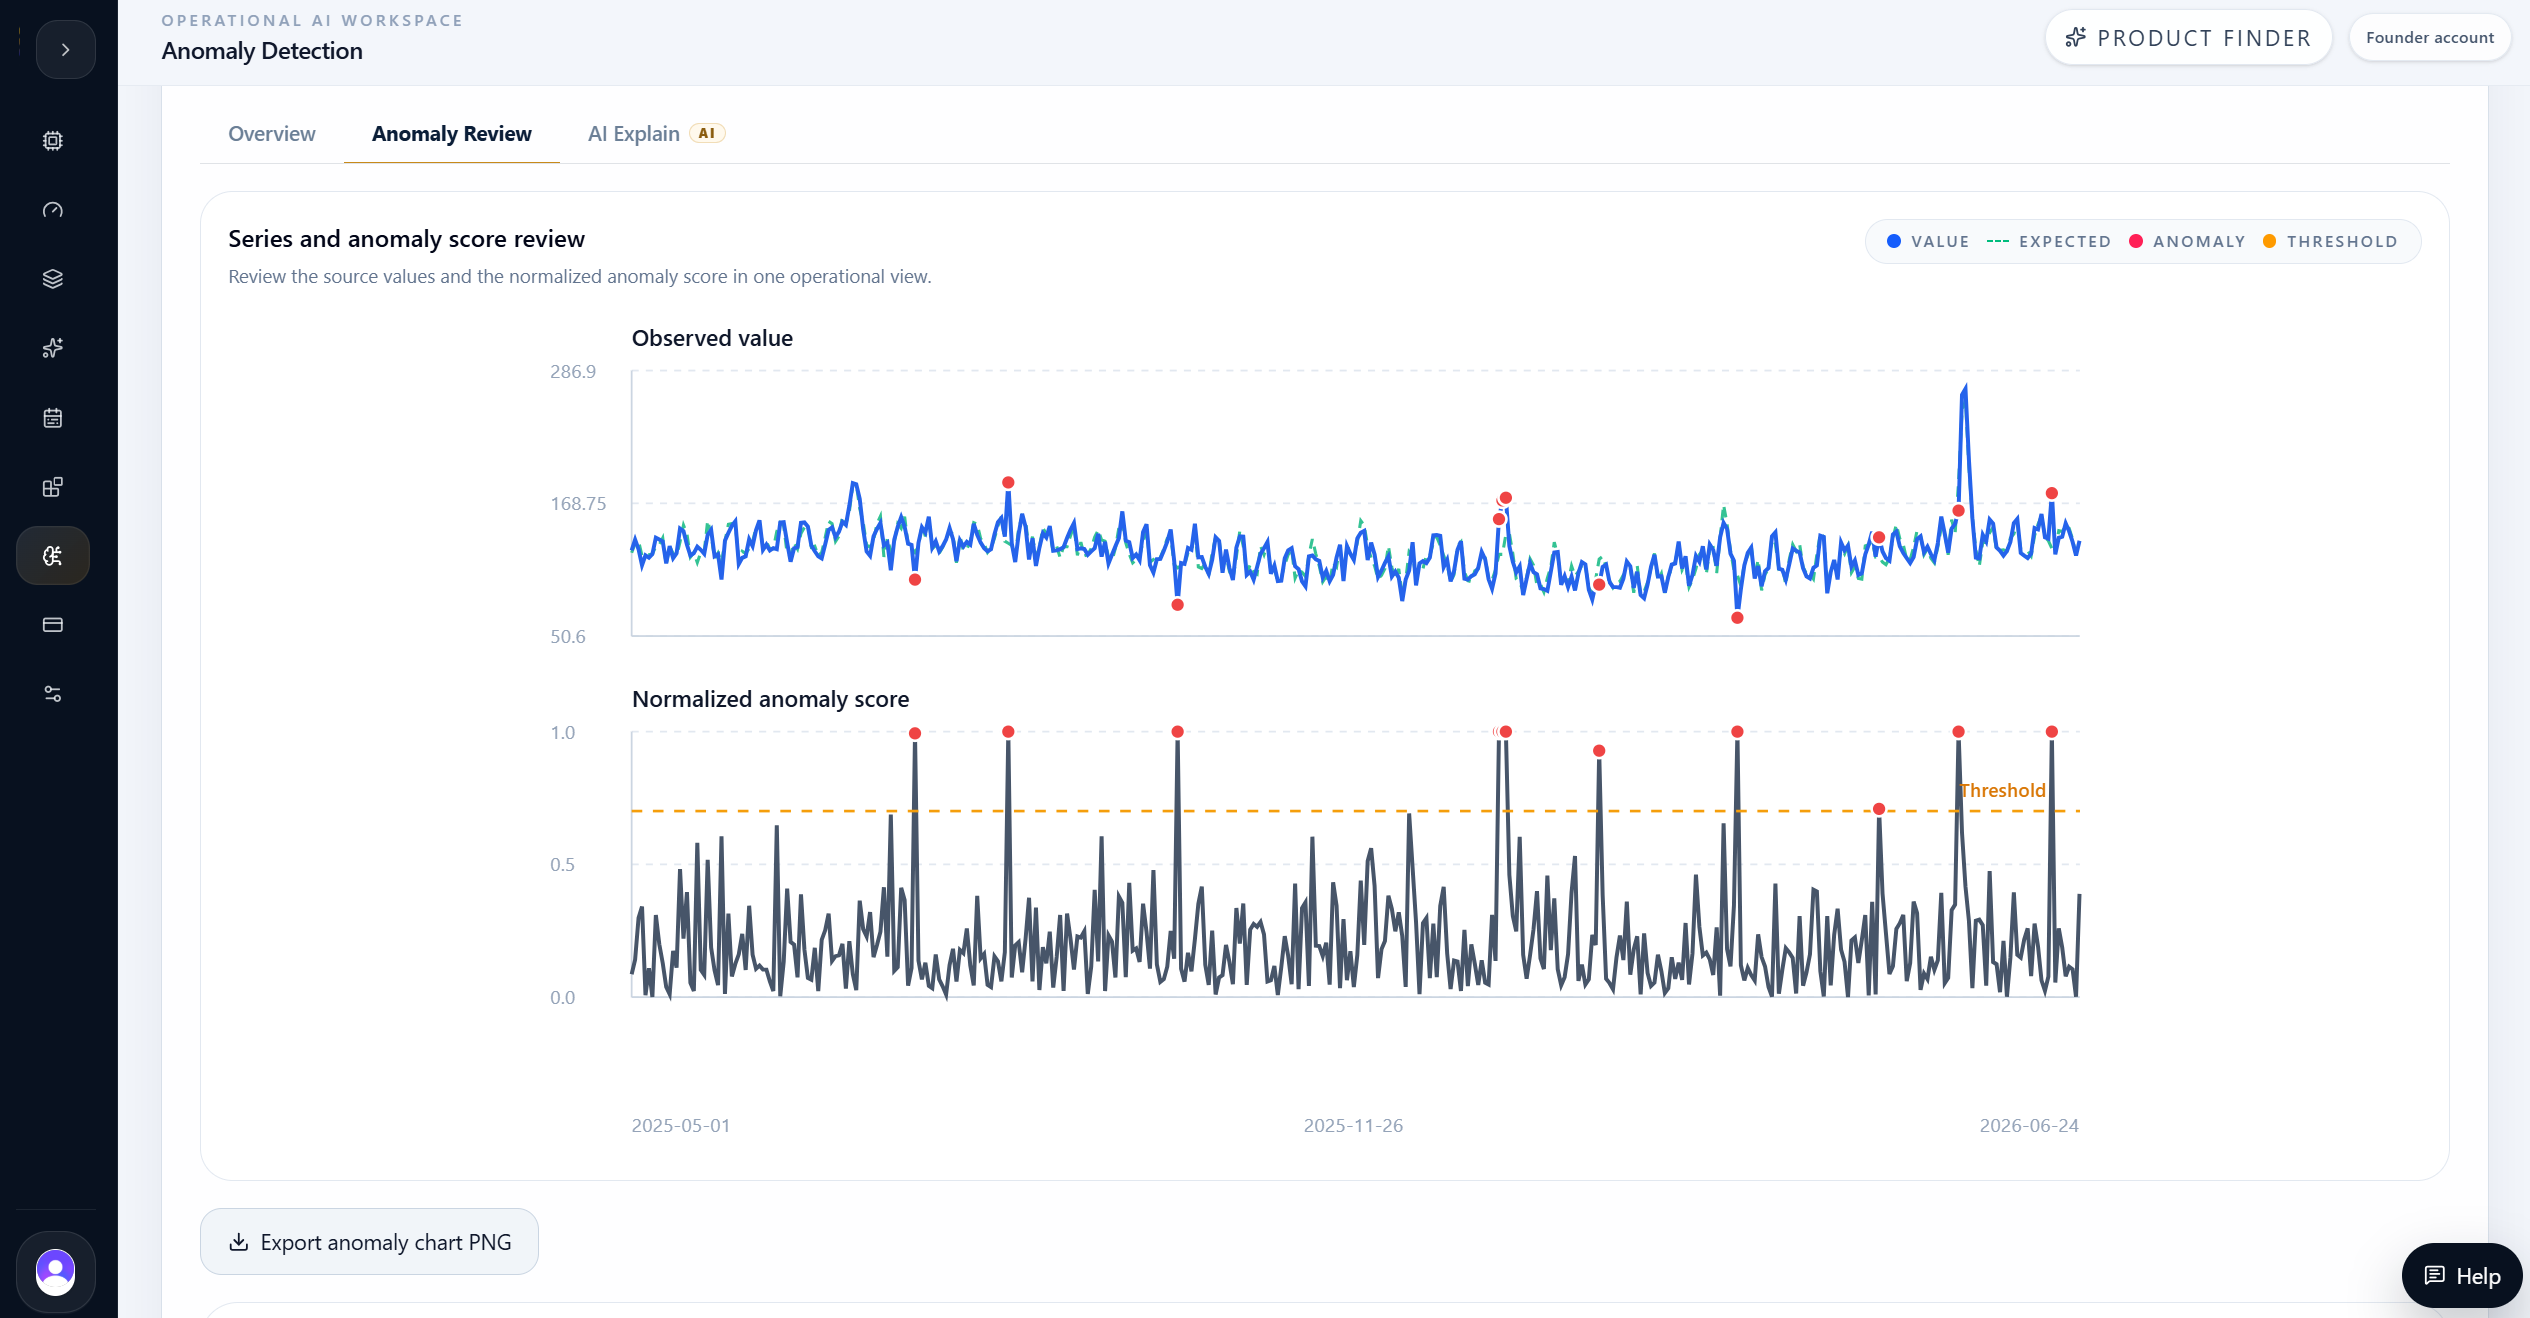
The Anomaly Review tab made the result readable. The upper chart showed the observed exception queue, expected baseline, anomaly markers, and threshold. The lower chart showed normalized anomaly score over time.
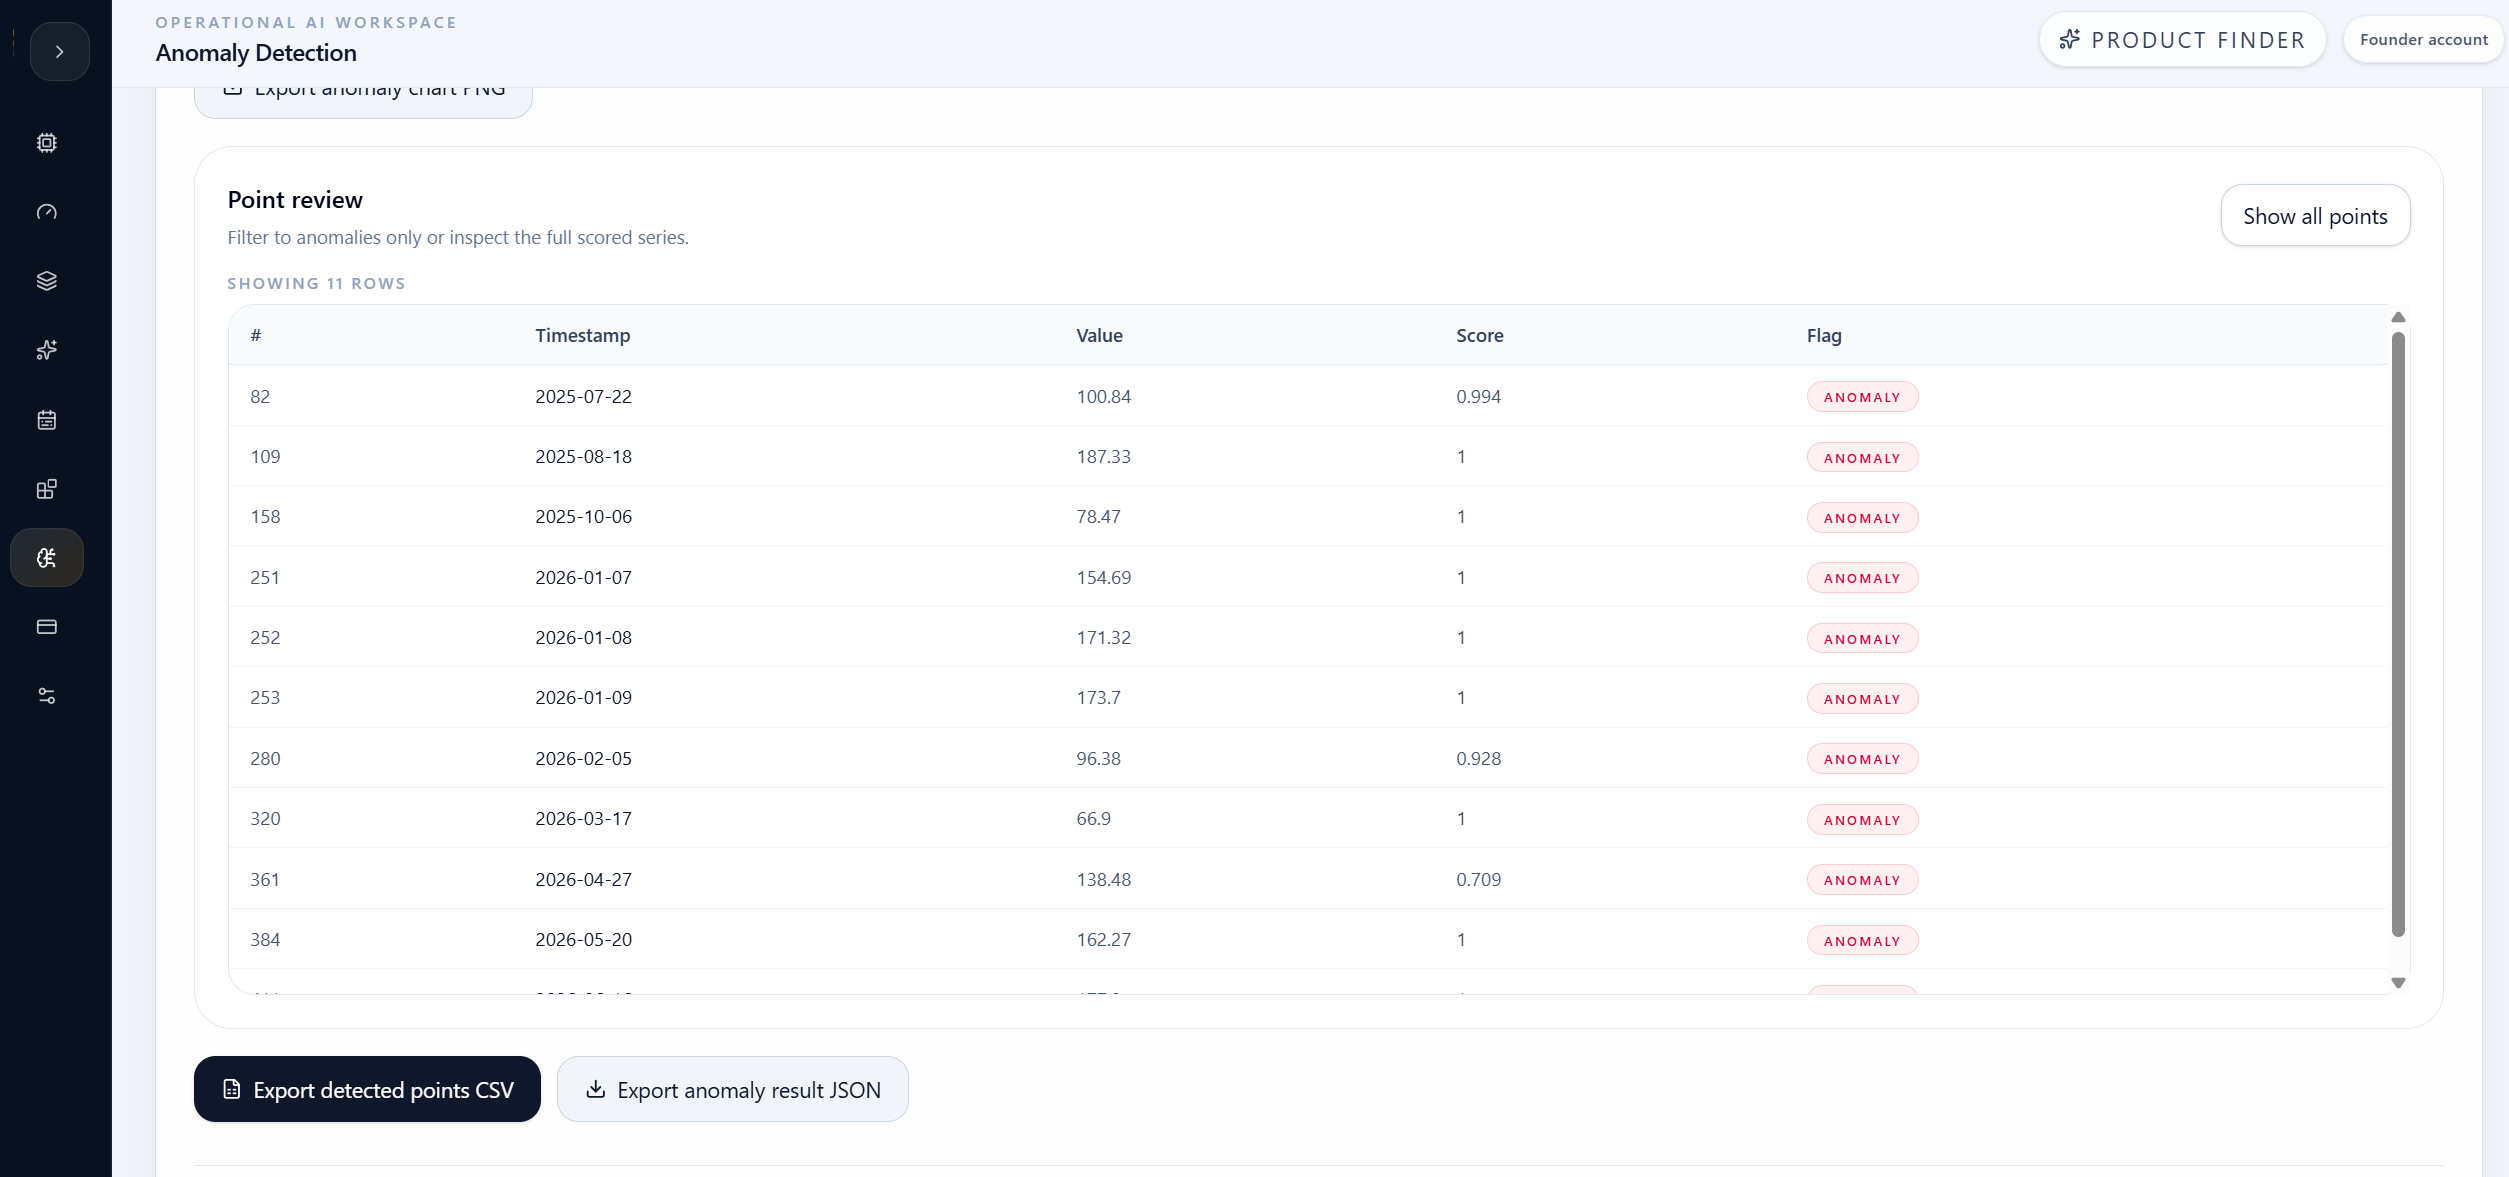
The flagged-point table then turned the chart into an action queue. Instead of asking an operator to scan 420 points manually, the product narrowed the review set to 11 dates.
The highest-priority investigation window was January 7-9, 2026. Other flagged dates included August 18, 2025; October 6, 2025; March 17, 2026; and June 16, 2026.
What operations can review first
- January 7-9, 2026 formed the clearest cluster.
- August 18, 2025 was a high exception spike relative to expected baseline.
- October 6, 2025 and March 17, 2026 were low anomalies, not simple high-volume spikes.
- The table preserved timestamp, observed value, normalized score, and anomaly flag.
- Exports were available for anomaly chart PNG, detected points CSV, and result JSON.
AI Explain
AI Explain translated the strongest cluster into operational next steps.
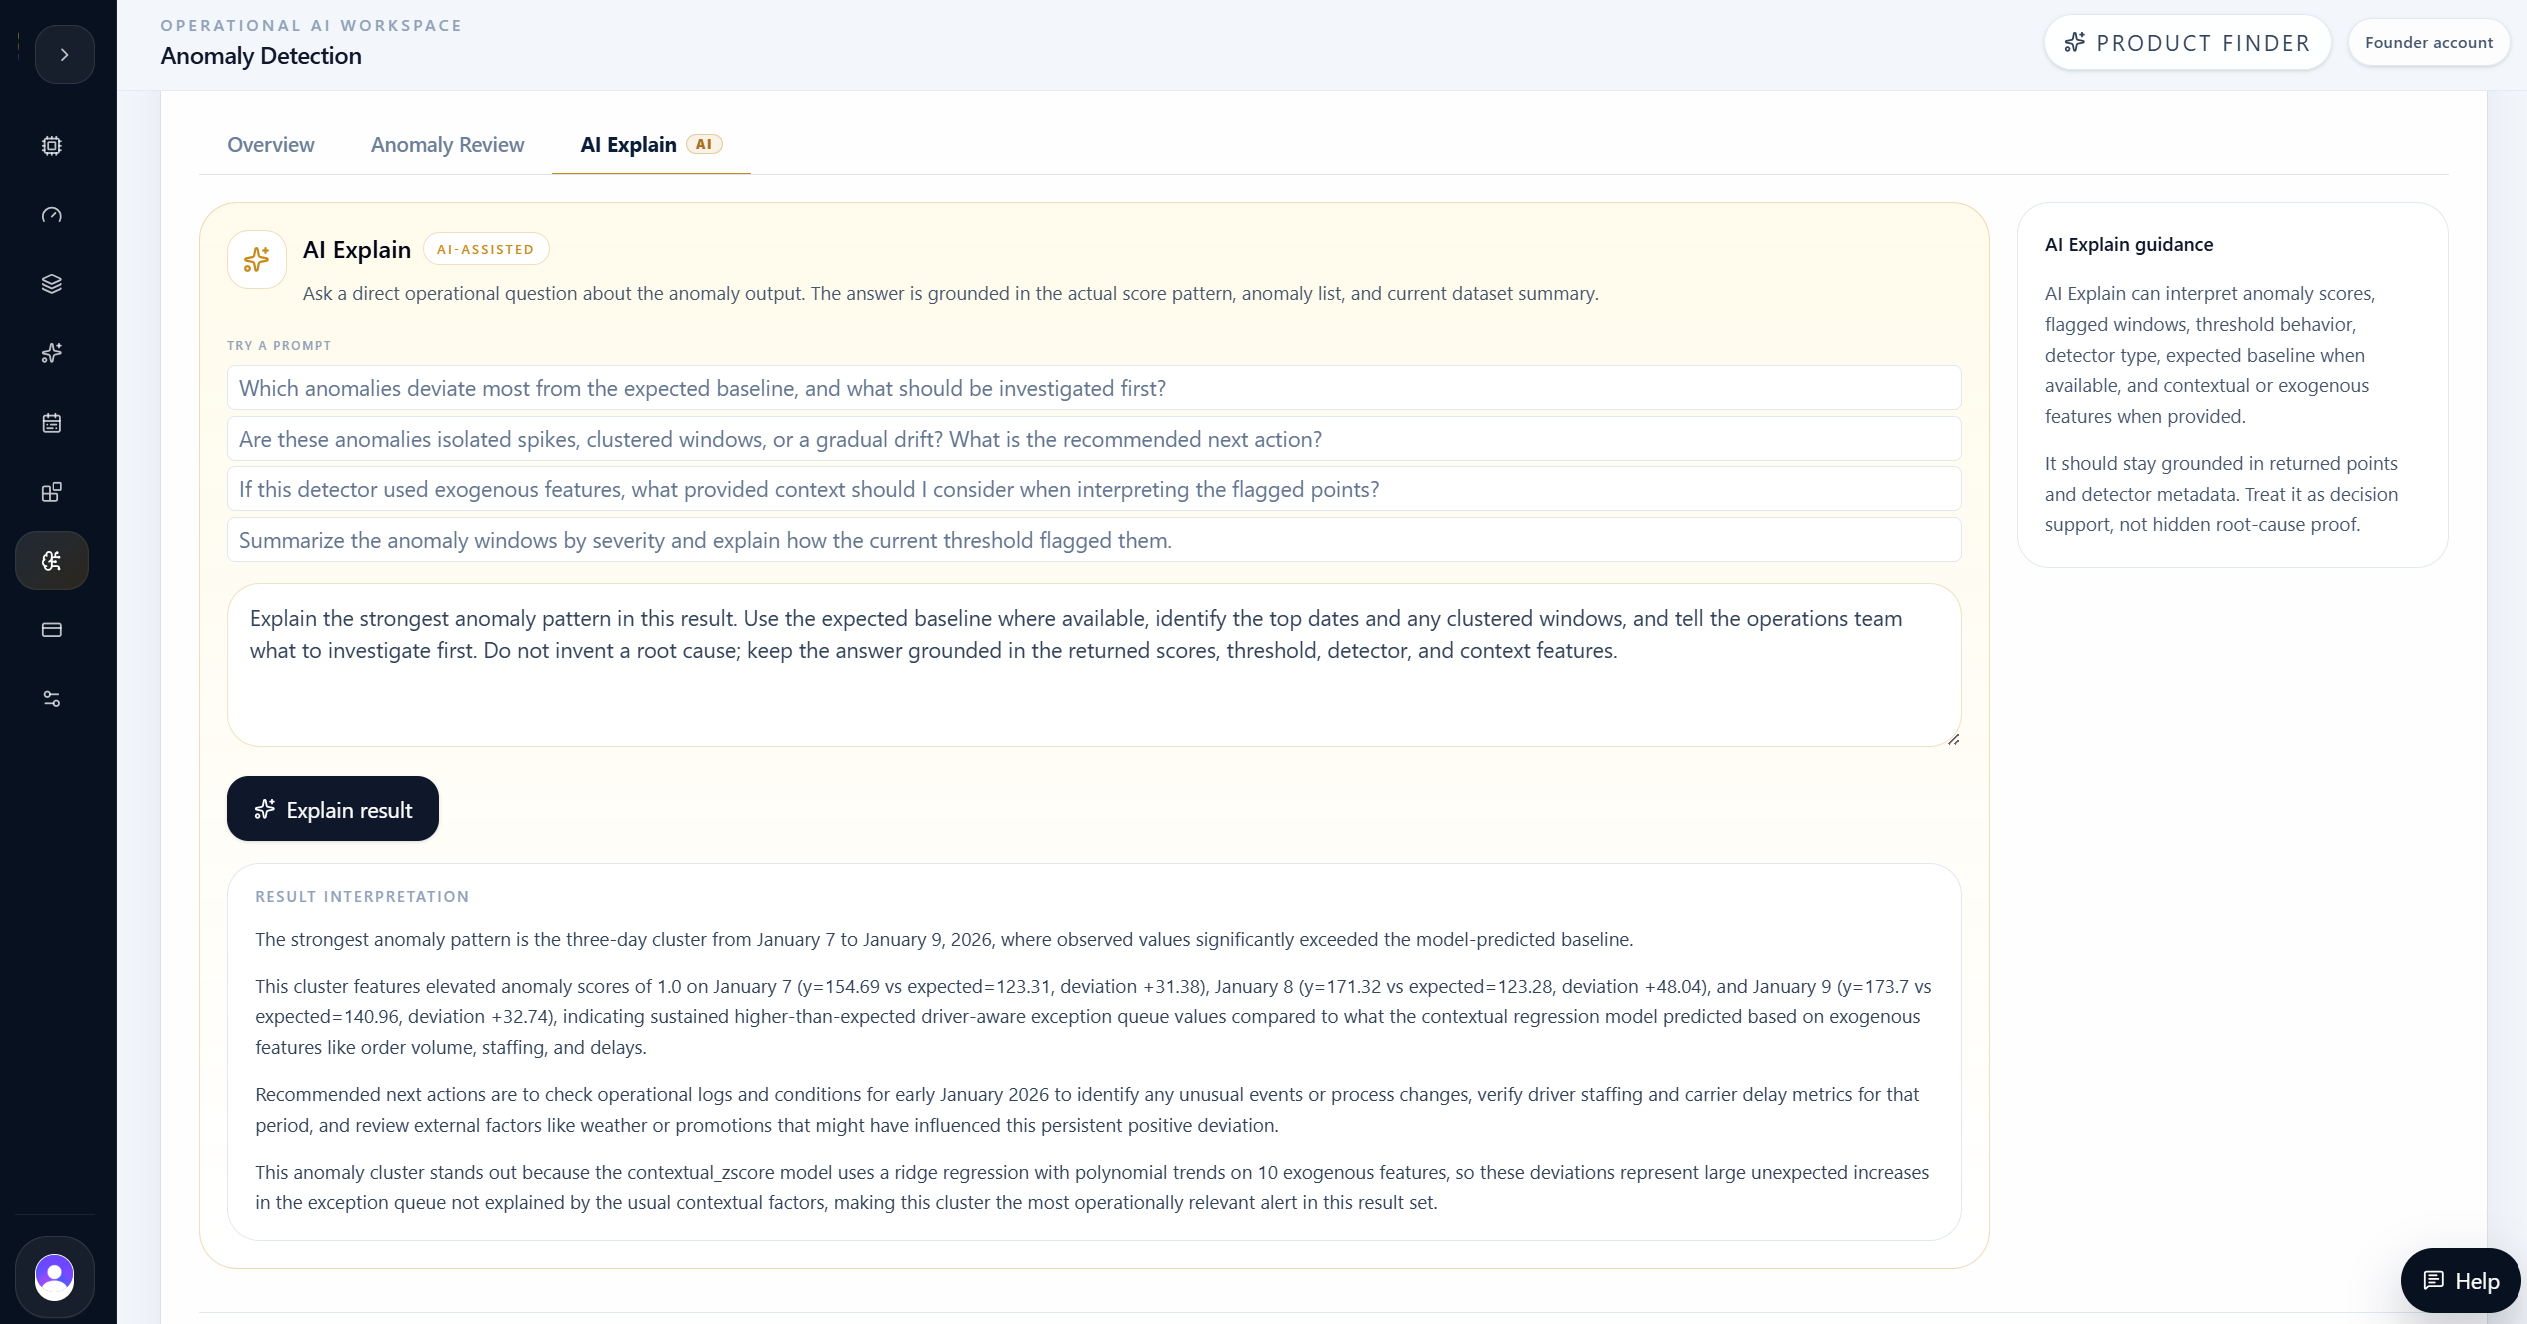
AI Explain was asked to identify the strongest anomaly pattern, use the expected baseline where available, call out top dates and clusters, and recommend what operations should investigate first.
The answer correctly focused on the January 7-9 cluster. It referenced observed values, expected baseline values, and deviations for each day in the cluster, then explained why the pattern was meaningful: the exception queue was higher than expected even after the contextual model considered operating conditions.
The answer also stayed within the right boundary. It recommended checking logs, staffing, carrier delay metrics, external conditions, and process changes. It did not claim to know the root cause.
Operating decision
Use the result as a focused exception-review queue.
The team should treat the Contextual Z-score result as an investigation queue for fulfillment operations. The run does not replace incident review, but it gives the team a better starting point than a static threshold or manual dashboard scan.
For this case, the immediate decision is to investigate the January 7-9 cluster first, then review the isolated high and low anomalies that also exceeded the threshold. The result highlights dates where the exception queue was unusual relative to expected operating conditions, not merely dates with large raw values.
This is the value of Anomaly Detection inside MAG OptiAI. It turns operational time-series data into a structured scoring workflow: validate the dataset, choose a detector that matches the signal, control review volume, inspect flagged points, and use AI Explain to translate score evidence into a practical investigation plan.
Final takeaway
The product did not claim automatic root cause. It turned a noisy daily exception queue into a reviewable anomaly shortlist with context, expected baseline, and AI-assisted investigation guidance.
The strongest decision signal was the January 7-9 cluster: investigate that sustained window first, then review the isolated high and low anomalies that also crossed the threshold.
Anomaly Detection is a scoring workflow, not a saved-model lifecycle.
Contextual Z-score is appropriate when the series has operational drivers.
Expected baseline makes anomalies easier to explain than raw score alone.
The product flags both high and low deviations.
AI Explain supports investigation planning without inventing root cause.