

Executive Summary
SchedAI turned a pressured baseline into a stronger recovery plan.
A regional HVAC and facilities service team needed to dispatch a week of commercial visits across the Greater Toronto area. The plan included 10 technicians, 45 visits, 28 customer sites, 2 depots, skill requirements, appointment windows, travel times, priorities, mandatory work, duty limits, overtime policy, and return-to-depot routing.
SchedAI Service generated a feasible baseline, but the result was not perfect. The baseline served 41 of 45 visits, left 4 visits unserved, created 5 minutes of tardiness, and required 23 minutes of overtime.
AI Explain identified the Wednesday refrigeration-and-controls surge as the main pressure point. The team then tested a combined recovery scenario: add a Wednesday relief technician with refrigeration and controls skills, and change the branch to open routes. The branch improved coverage to 43 of 45 visits, reduced unserved visits from 4 to 2, removed tardiness, removed overtime, and sharply reduced travel burden.
Coverage
91.1% to 95.6%
Unserved visits
4 to 2
Overtime
23 min to 0
Core capabilities exercised
- Multi-file service bundle with technicians, locations, visits, travel times, and travel distances.
- Technician skills, depot start/end locations, shift windows, duty limits, overtime limits, and fairness eligibility.
- Visit time windows, service durations, priority, mandatory flags, required skills, and route feasibility.
- Complete location-to-location travel-time and distance matrices for route-aware planning.
- Service policy controls for route-end policy, unserved visits, tardiness, overtime, runtime, and solver engine.
- Timeline, route map, assignments, route stops, KPI review, and exportable operational outputs.
- AI Explain, What-if Analysis, and AI Compare for interpreting pressure and testing recovery branches.
Field-Service Context
A real HVAC dispatch problem with skills, travel, and appointment windows.
The service team supports commercial HVAC and facilities calls across a dense metro area. A weekly dispatch plan may include diagnostics, refrigeration work, controls work, boiler service, inspections, and general HVAC visits across multiple customer sites.
The operation is not a simple appointment calendar. Each visit has a location, appointment window, service duration, priority, required skills, and service-timing rules. Each technician starts from a depot, works within a dated shift window, has a skill profile, and must absorb real travel between sites.
SchedAI was used to evaluate whether the team could cover a realistic weekly workload before dispatching the plan. The goal was to make the service decision visible: which visits can be covered, which visits remain exposed, how much travel the plan creates, and whether a combined operational change is worth adopting.
Scheduling Challenge
The plan had to recover service coverage without hiding route burden.
The planning team needed a route plan that could protect high-priority service commitments without hiding skill bottlenecks or route burden.
Manual dispatch can look reasonable when every technician has work on a calendar, but still miss specialized visits, create excessive return travel, push a technician into overtime, or leave a tightly timed refrigeration/control visit dependent on too little qualified capacity.
The important question was not only whether a feasible baseline existed. The team needed to know which recovery lever would actually improve the plan before dispatch: adding targeted capacity, changing route policy, or both together.
Constraints considered
- Visits required specific skills or skill combinations.
- Technicians started from assigned depots.
- Appointment windows constrained feasible service timing.
- Travel time affected which visit sequences were practical.
- Mandatory high-priority visits had to remain covered.
- The Wednesday refrigeration-and-controls surge created the core bottleneck.
- The team needed evidence before adding capacity or changing route policy.
Method: Input Setup
The team loaded the full service routing bundle.
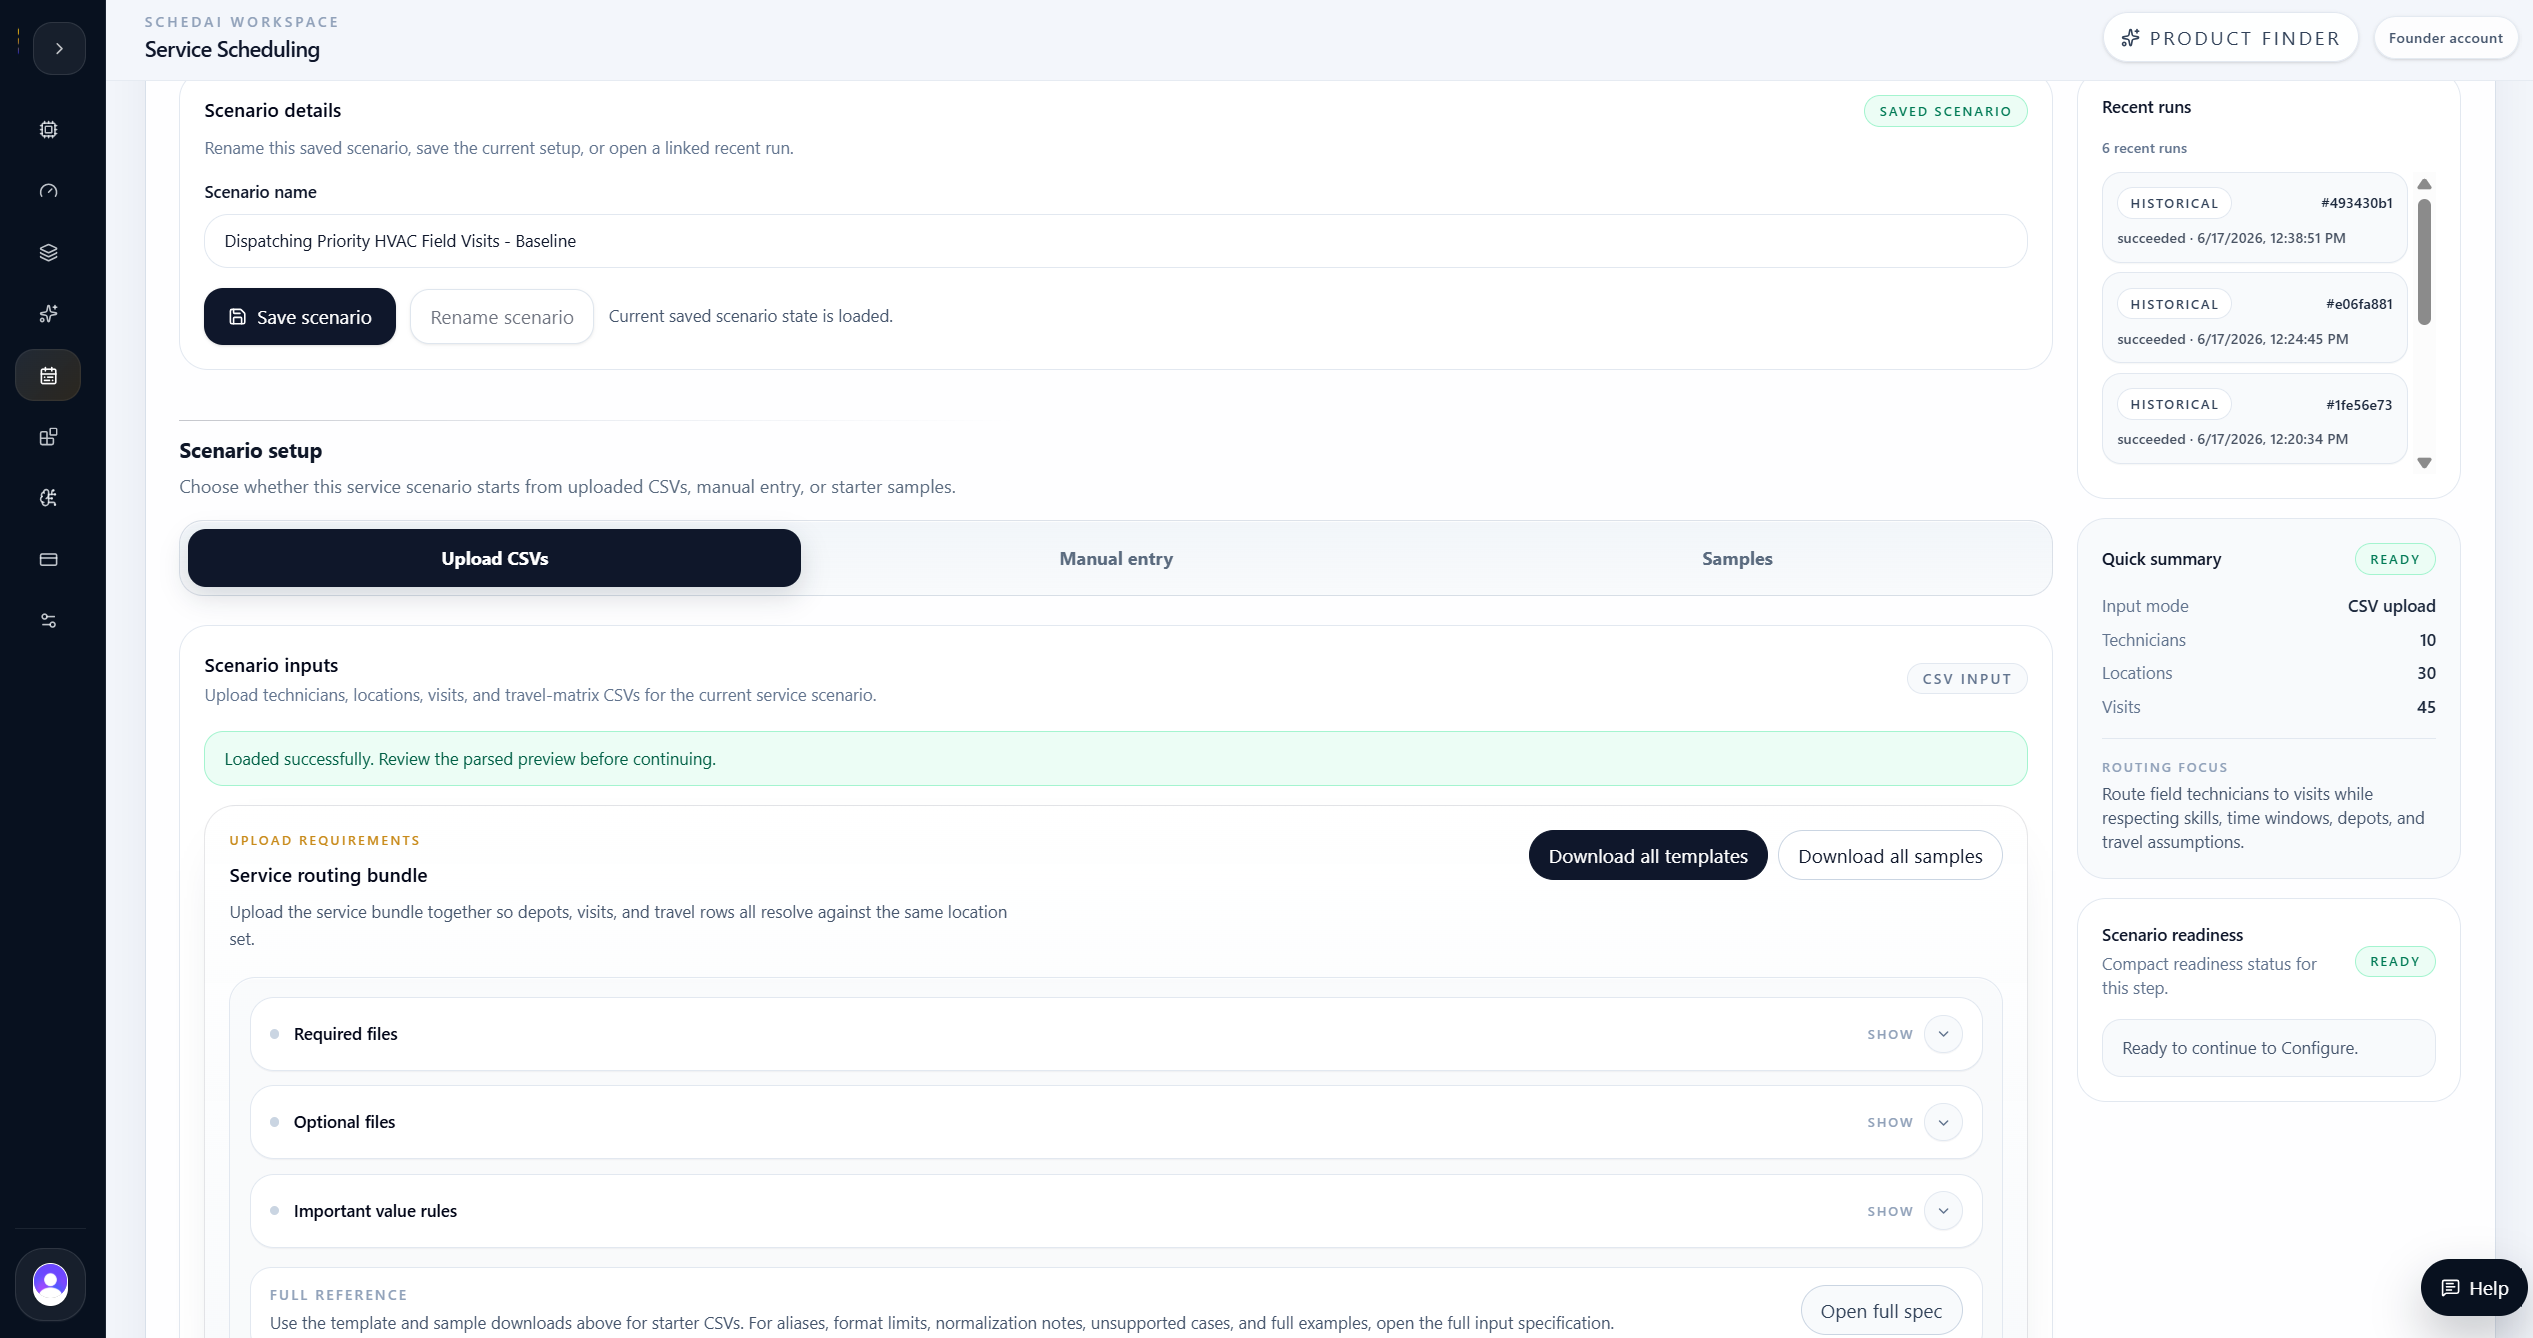
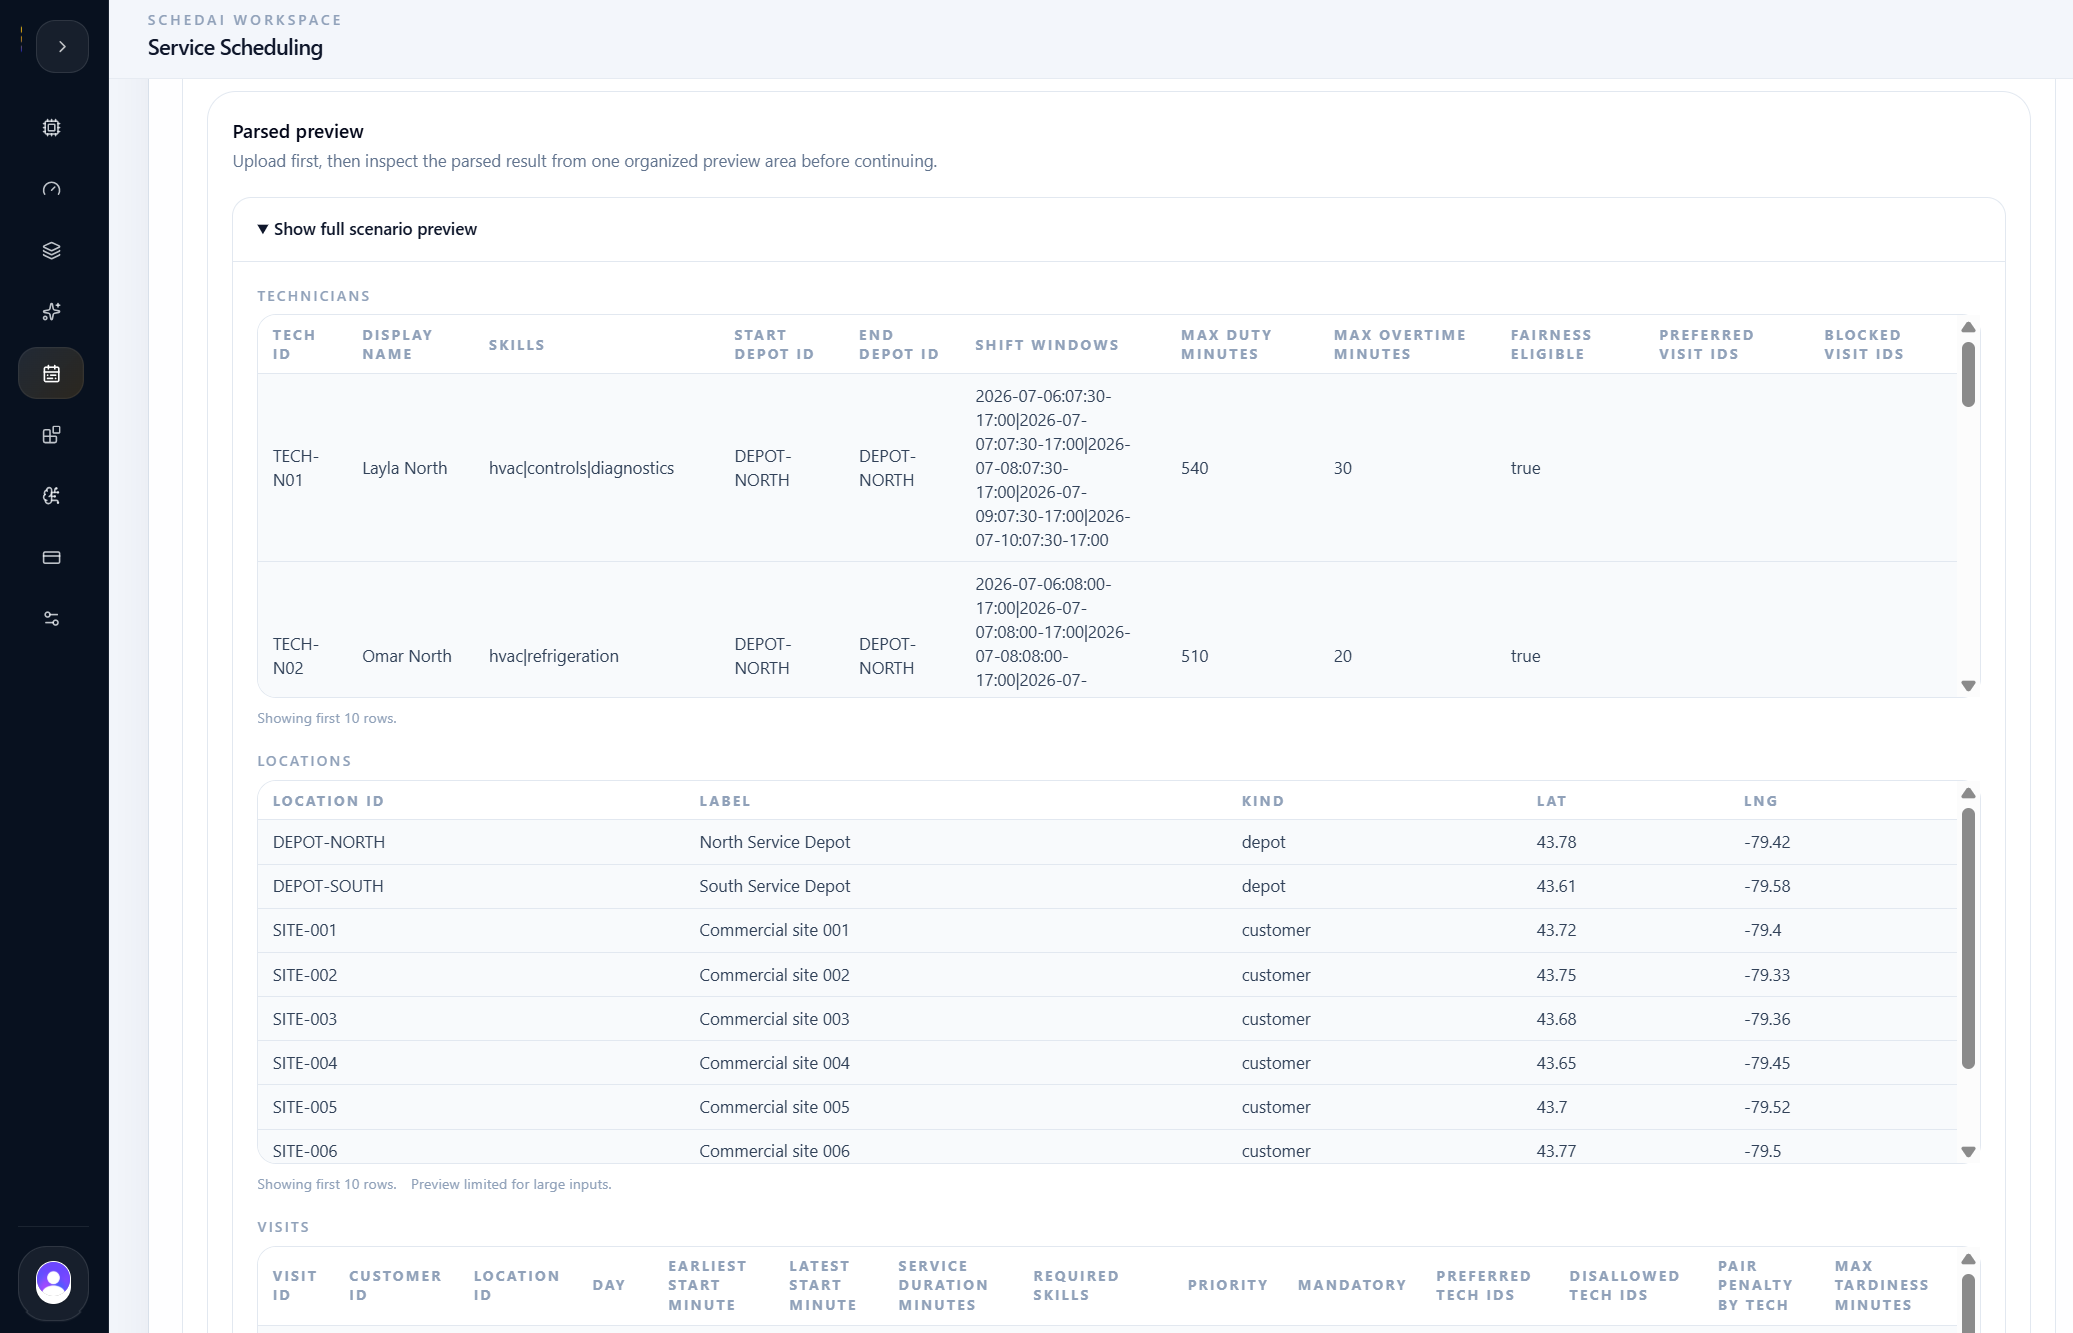
The team first uploaded the full service scheduling bundle. The v2.2 scenario included technicians, service locations, visits, travel times, and travel distances.
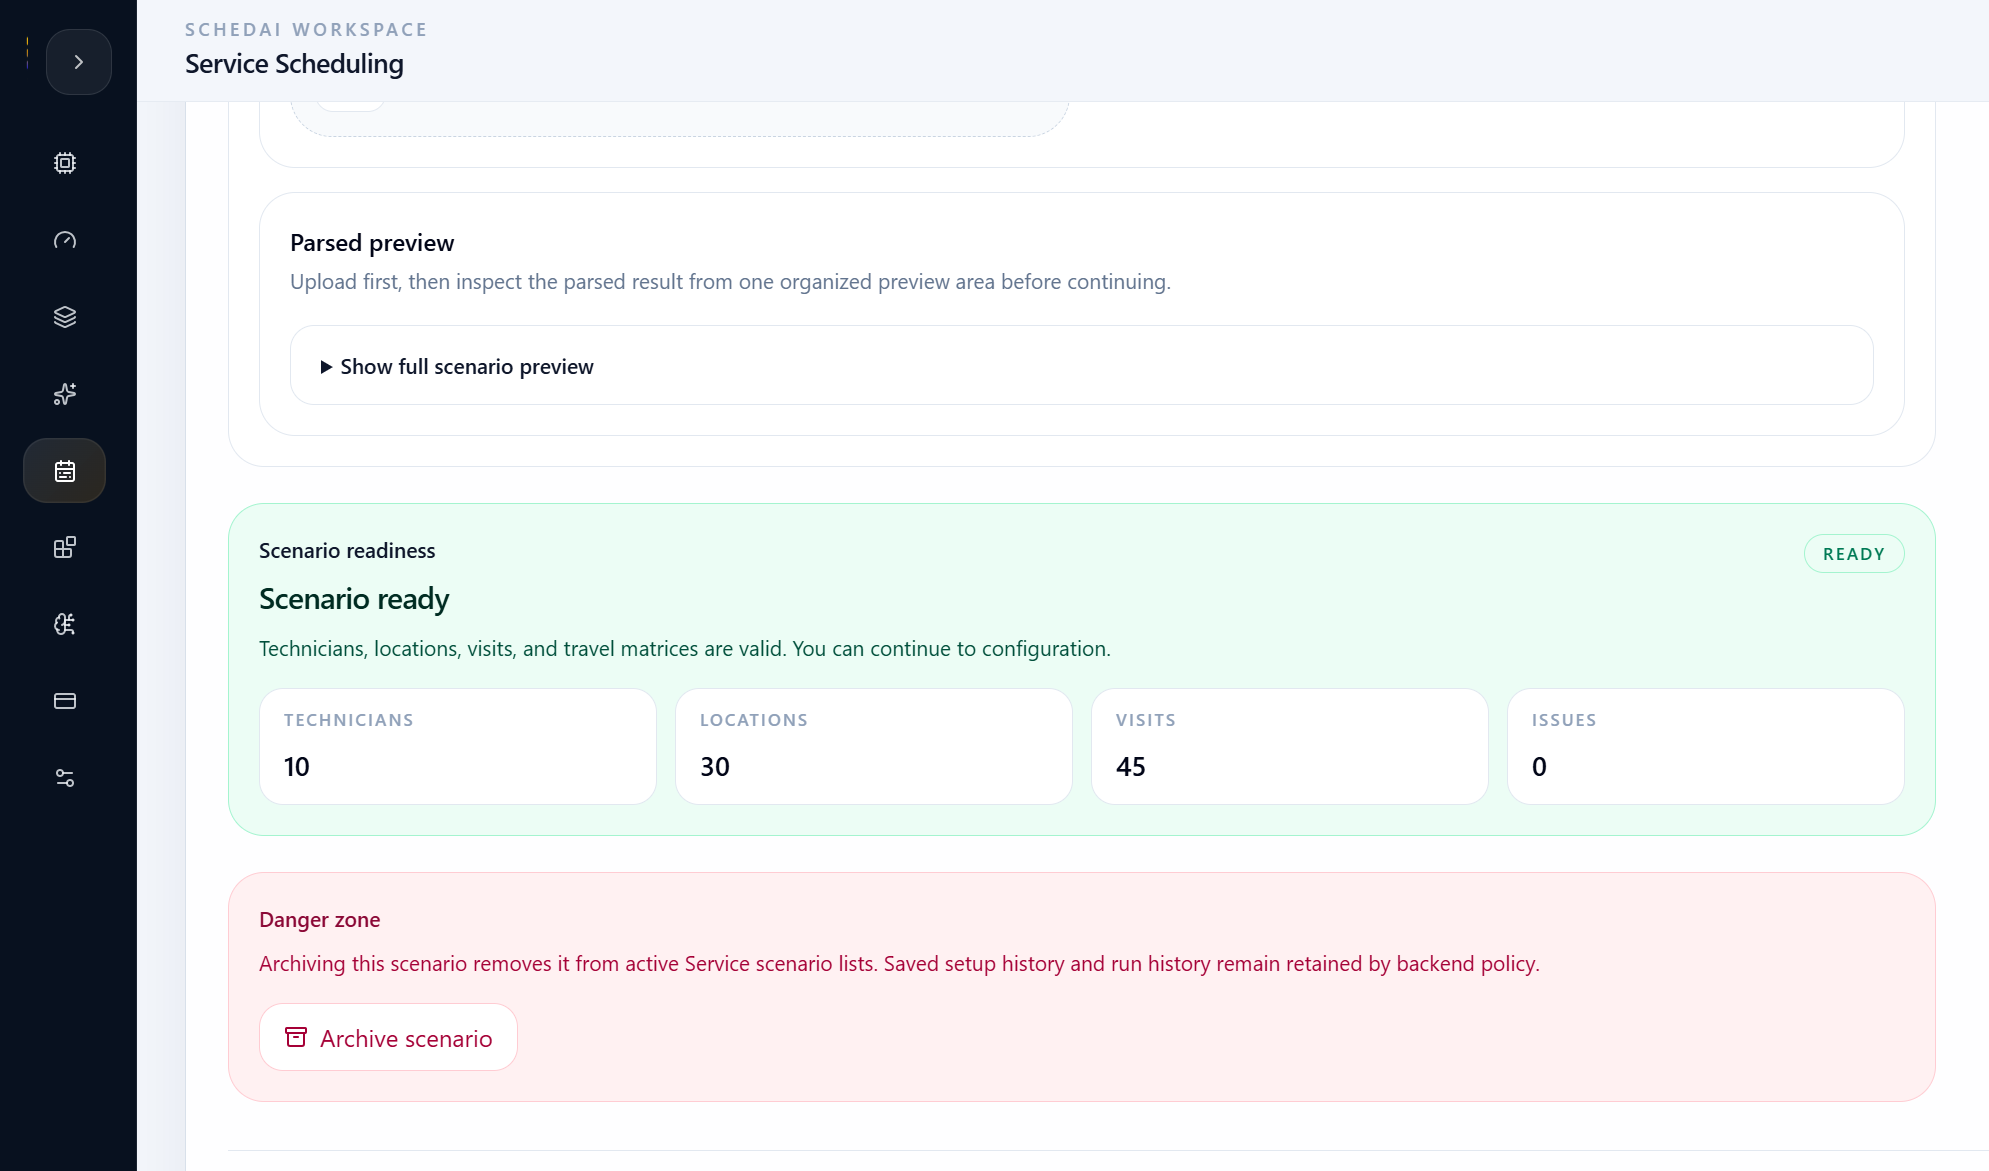
The uploaded data represented a backend-validated routing problem: 10 technicians, 45 visits, 28 customer locations, 2 depots, and a complete 30-location travel matrix.
Before optimization, the workspace validated the bundle so depot references, customer locations, visit IDs, technician references, and matrix rows could be reviewed as one connected service scenario.
Input setup included
- Technician roster and skills
- Depot start and end assignments
- Weekly shift windows
- Customer locations with coordinates
- Visit windows and service durations
- Required skills and priorities
- Travel-time and distance matrices
Method: Configuration
The service policy kept baseline pressure visible.
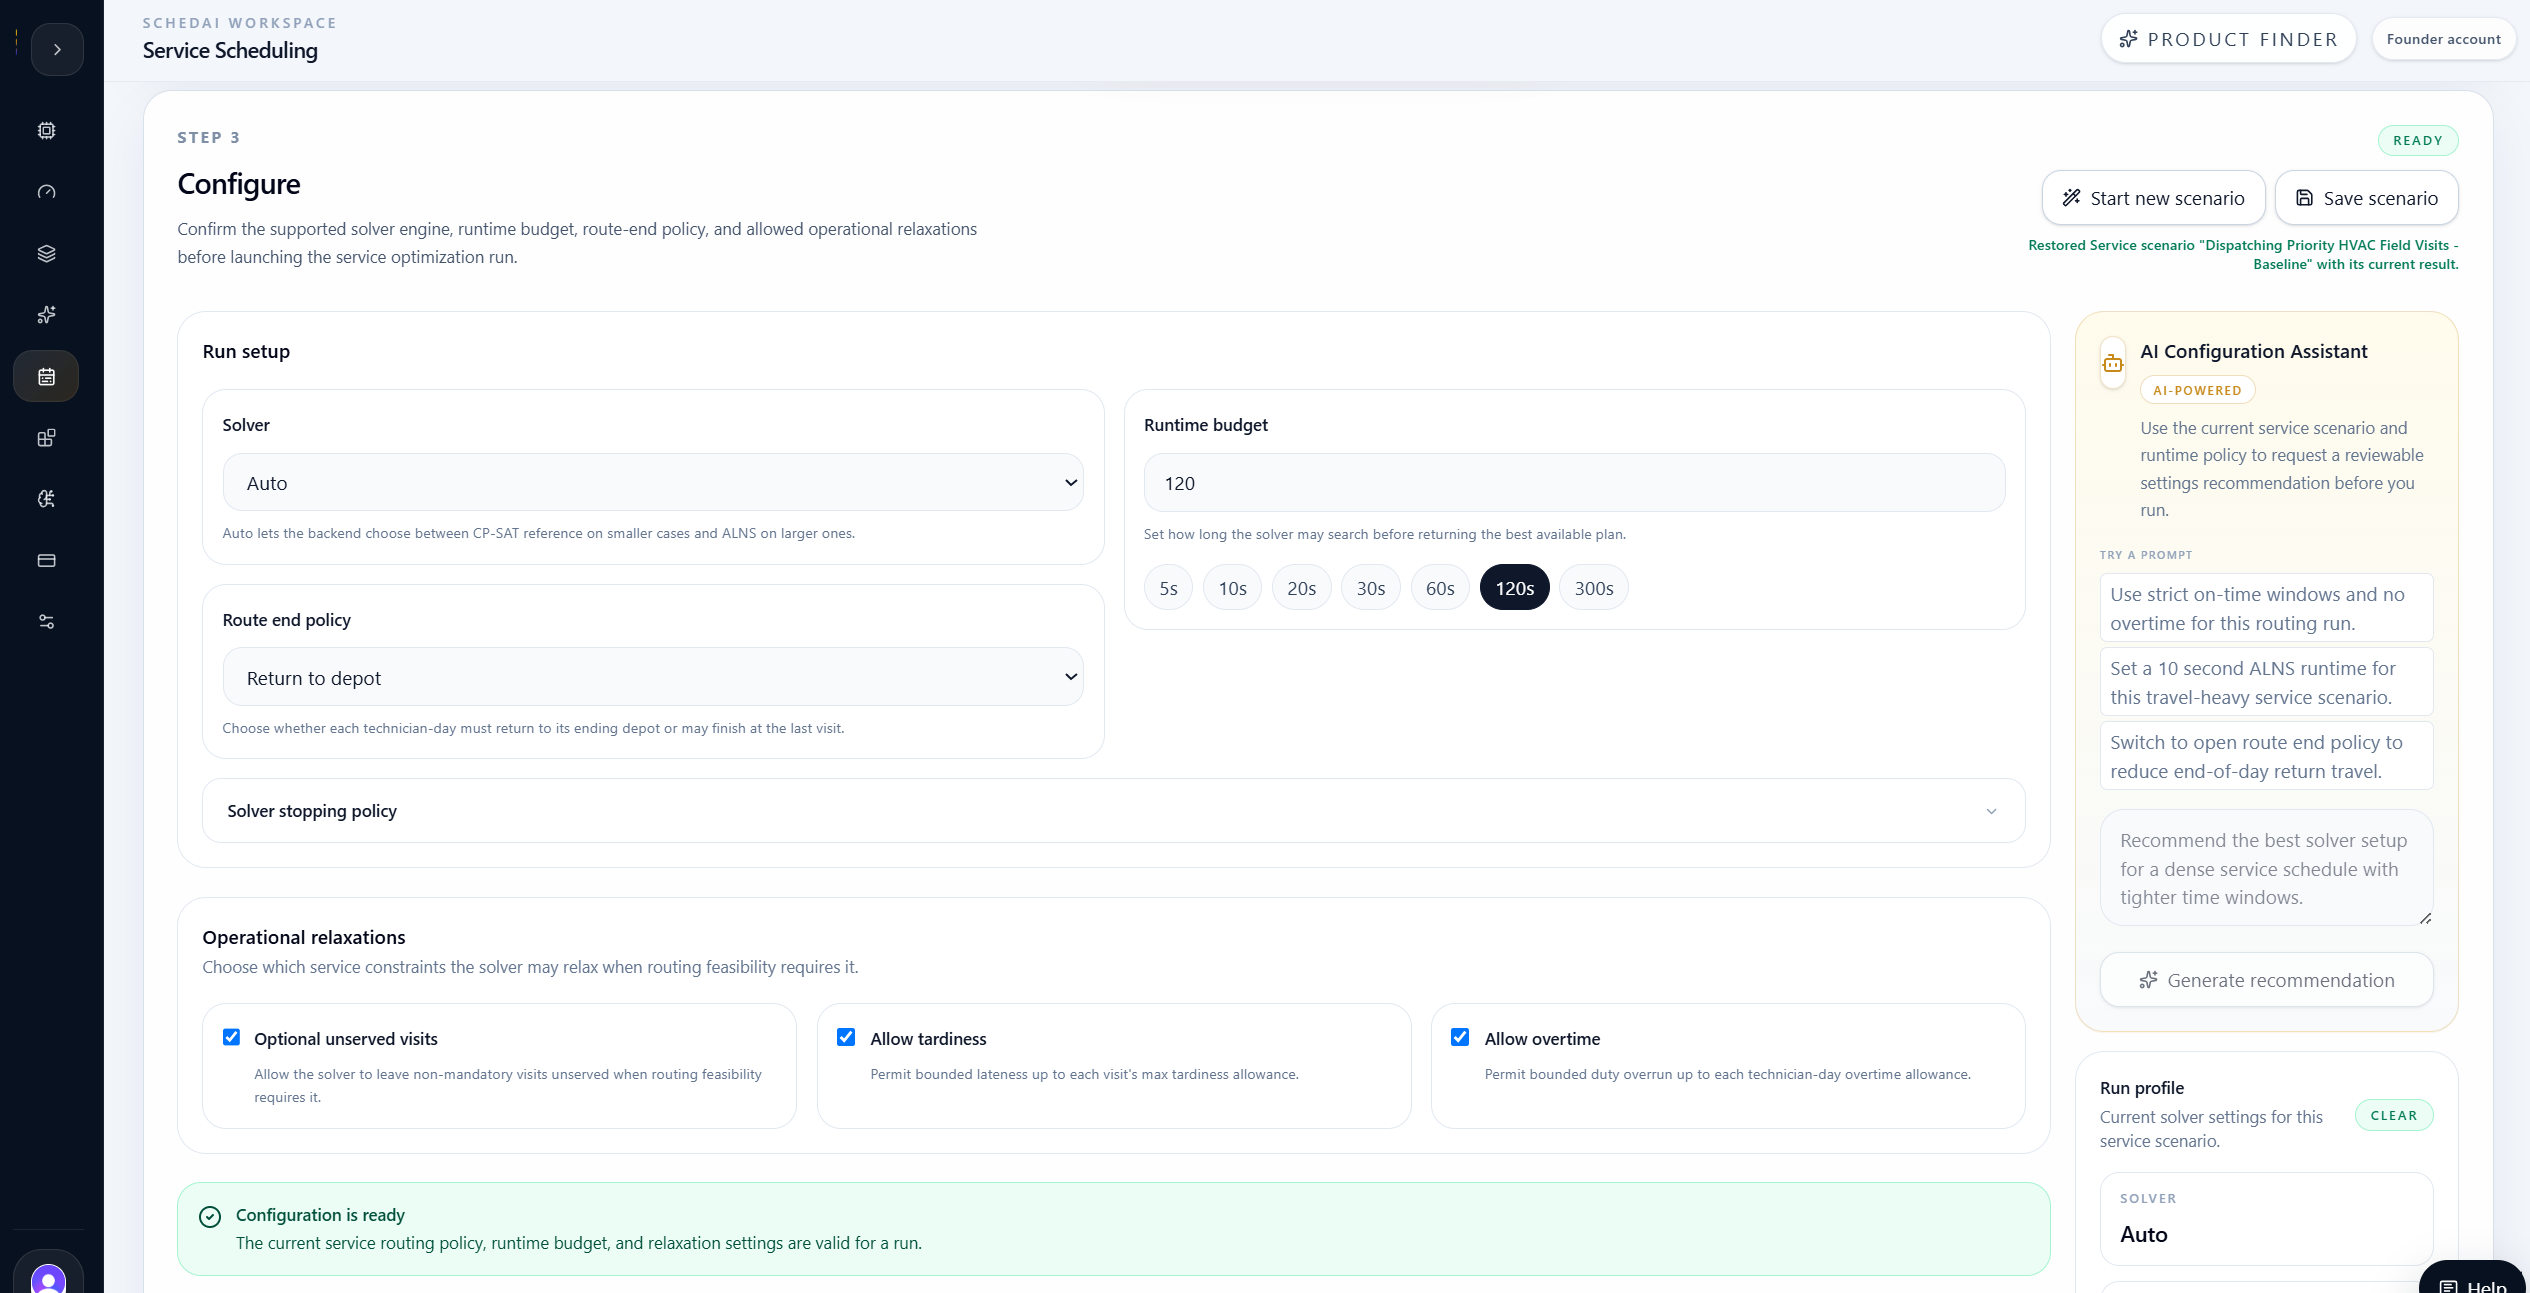
After setup, the team configured the service policy and solver settings. The captured baseline used Auto solver selection with a 120-second branch policy visible in the workspace.
The baseline kept return-to-depot policy enabled, with unserved visits, tardiness, and overtime allowed so the solver could produce a truthful feasible plan while keeping service pressure visible.
That configuration mattered because the team did not want a perfect-looking result that hid gaps. They wanted a measurable baseline that showed what was covered, what was missed, and where a targeted branch might improve the plan.
- Auto solver selection for the service-routing instance.
- Return-to-depot route-end policy in the baseline.
- Unserved visits, tardiness, and overtime controls visible before launch.
- AI-assisted configuration available for service-policy guidance.
Method: Run Optimization
SchedAI translated service inputs into a constrained dispatch model.
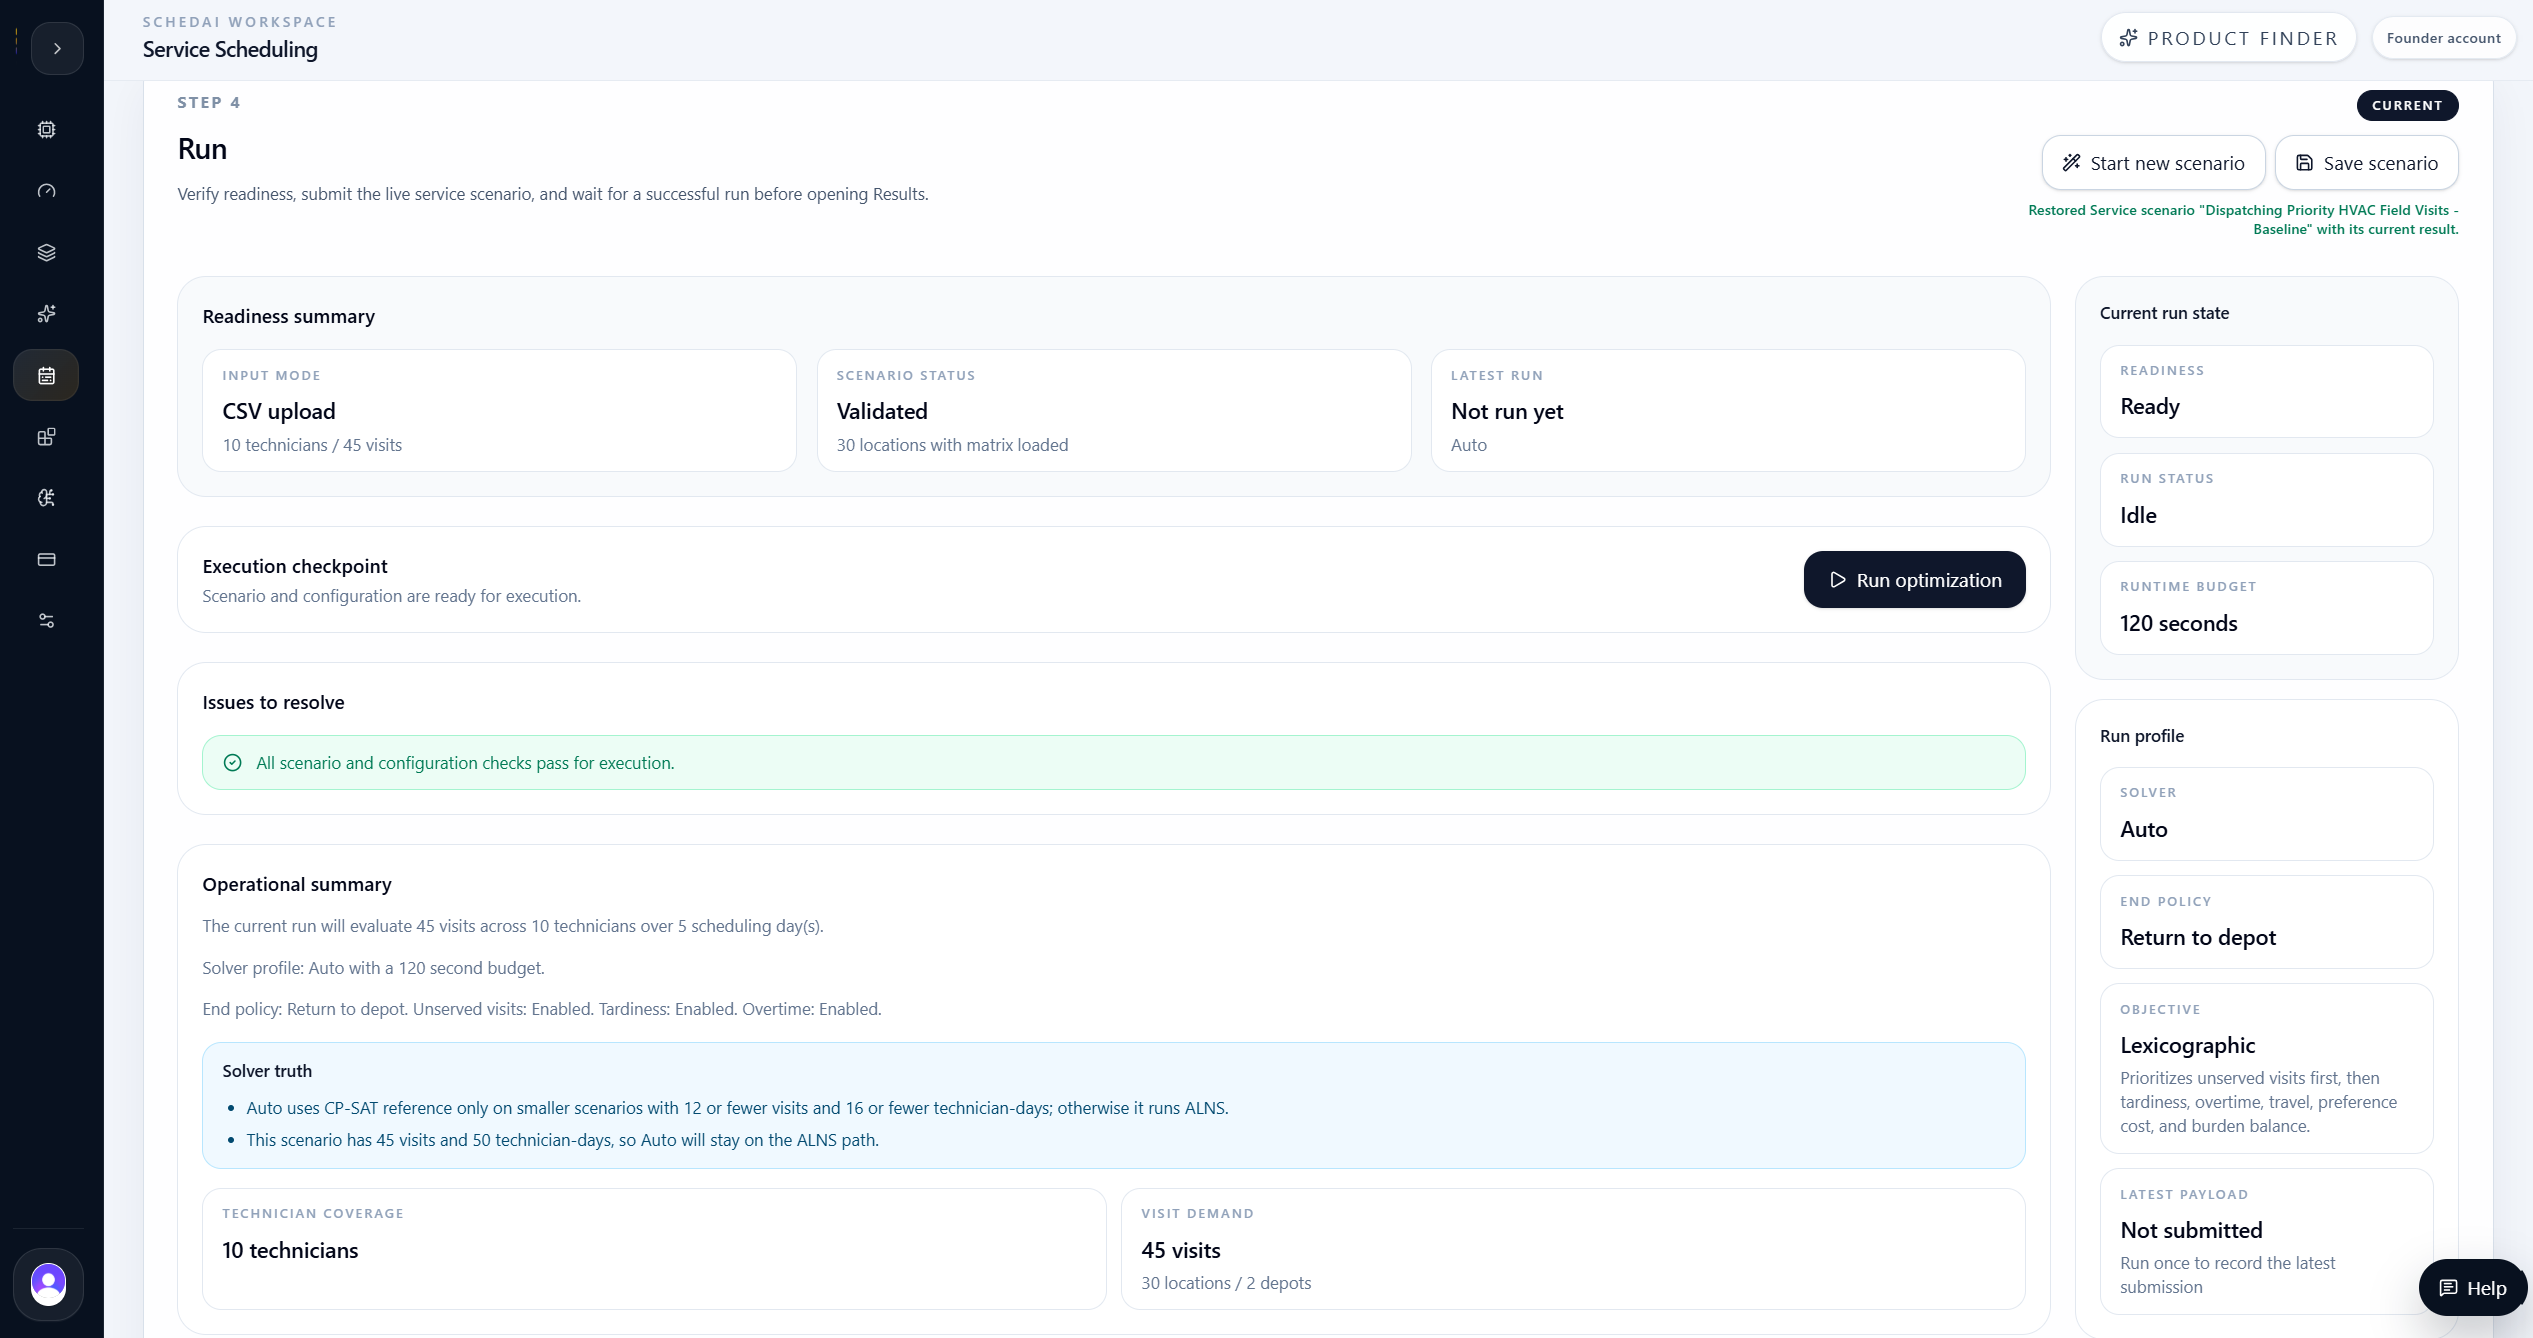
SchedAI translated the service bundle and configuration into a constrained routing and assignment problem.
The run checked whether all visits could be assigned to qualified technicians while respecting time windows, shift windows, travel times, service durations, depot policy, duty limits, and selected operational relaxations.
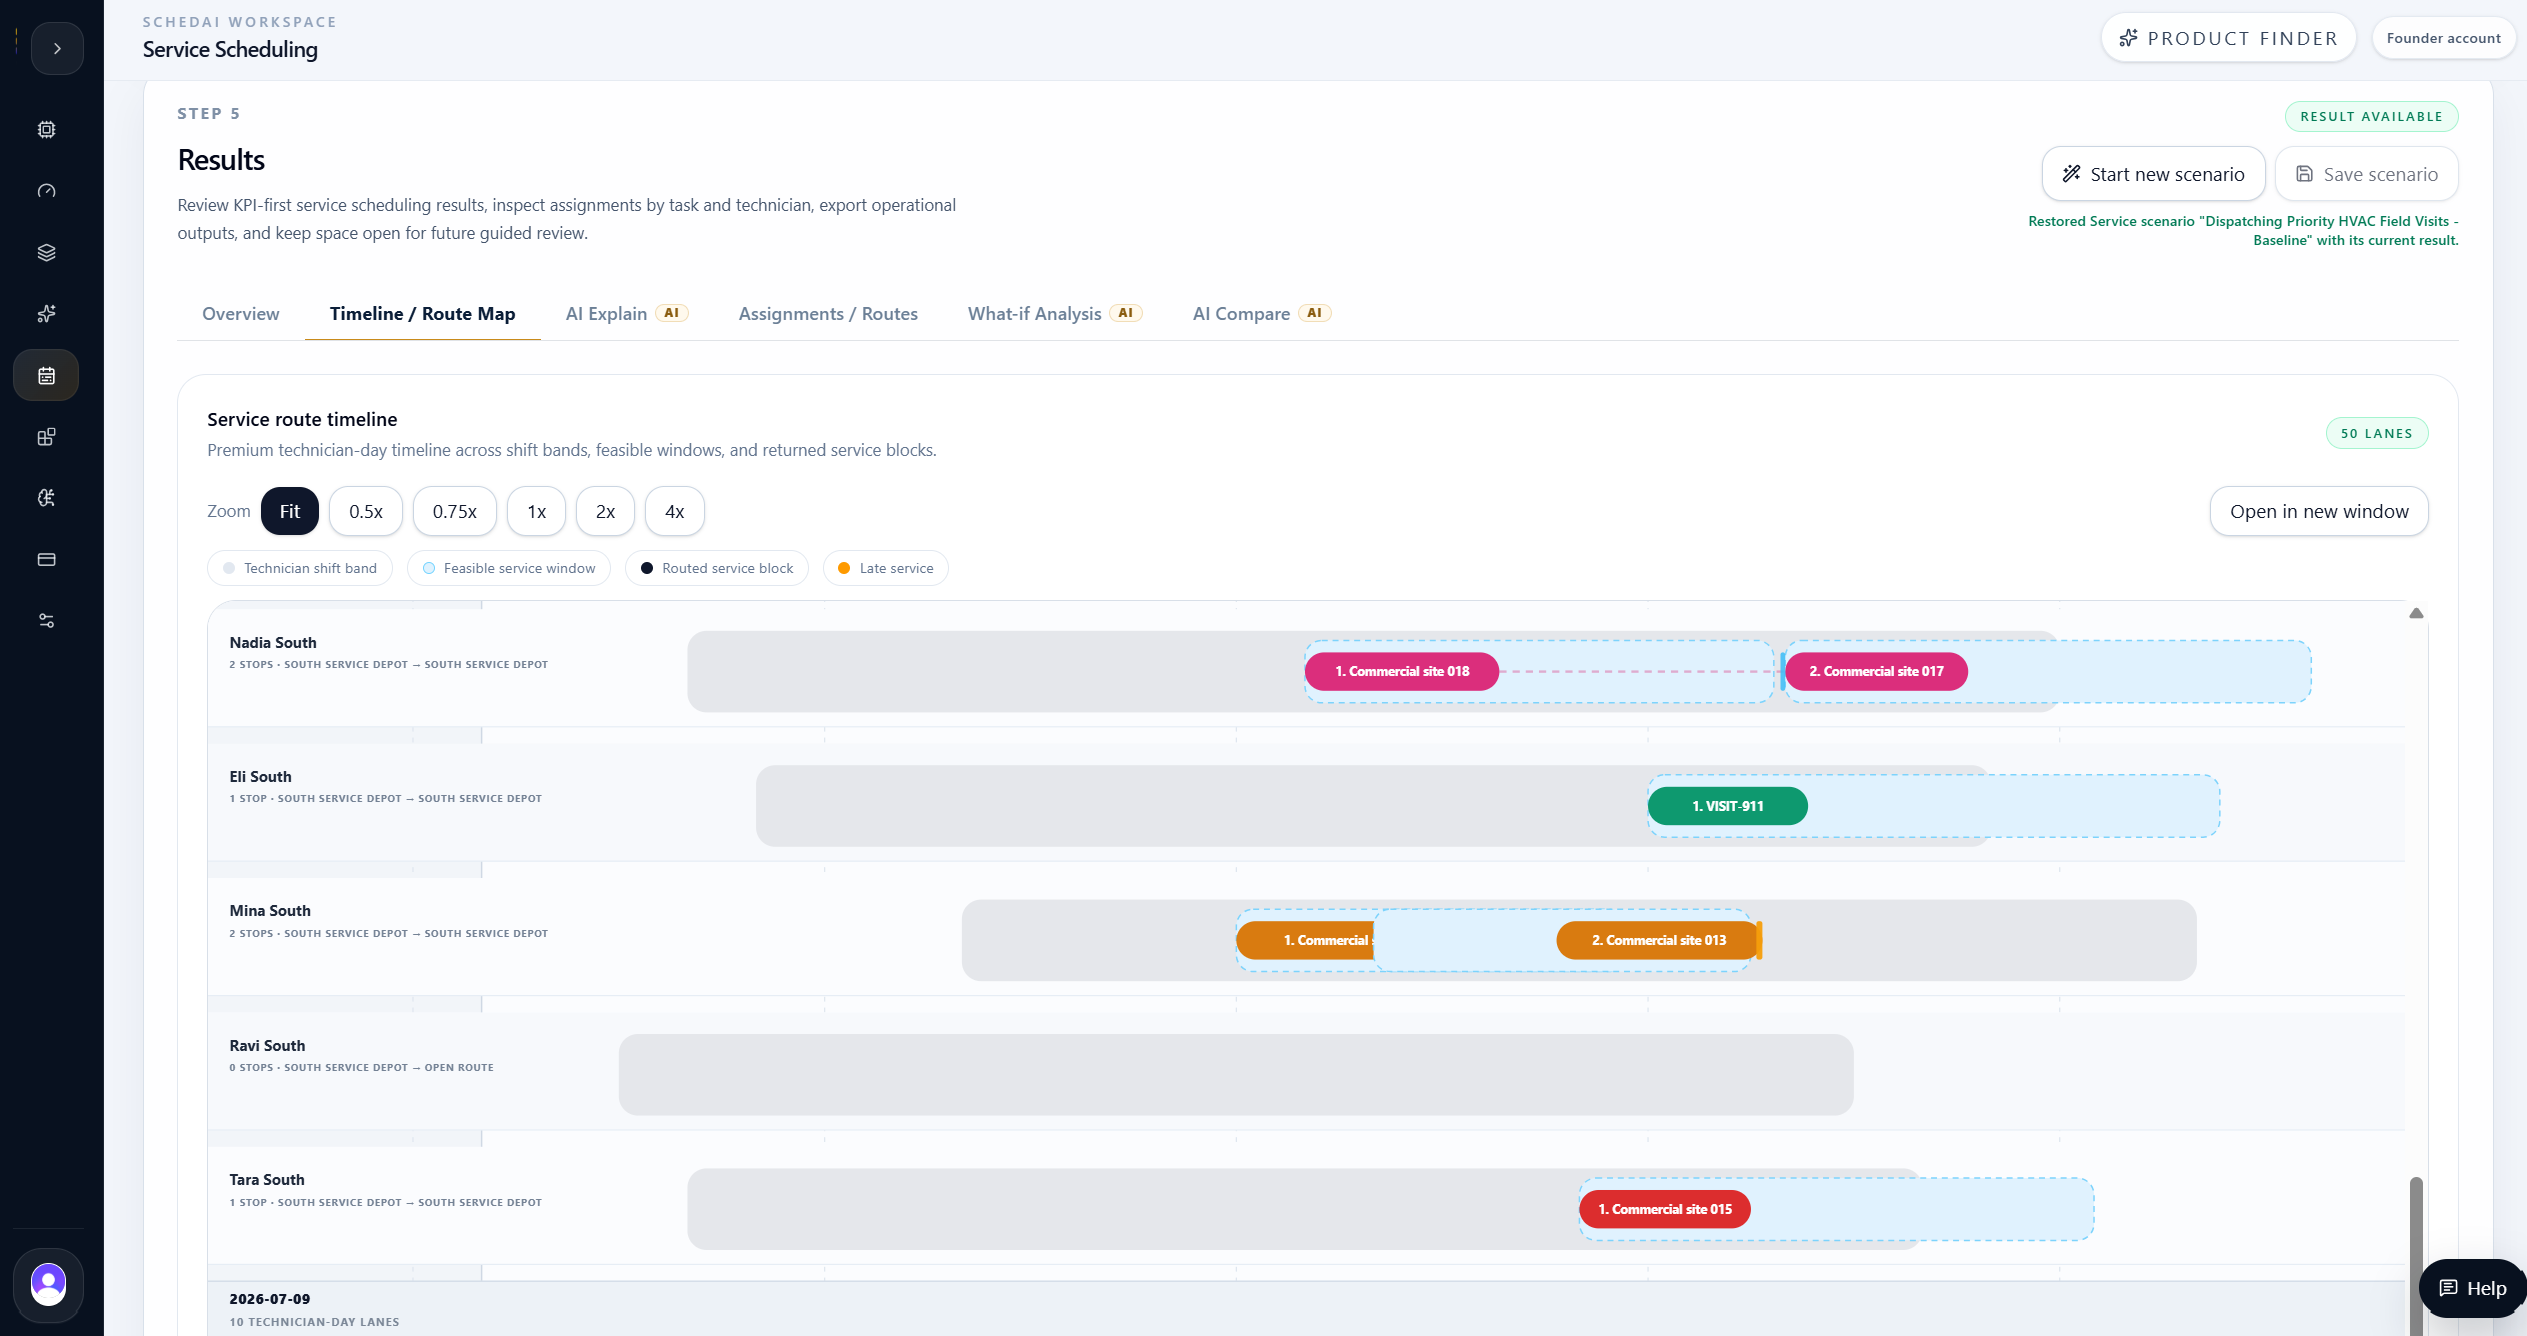
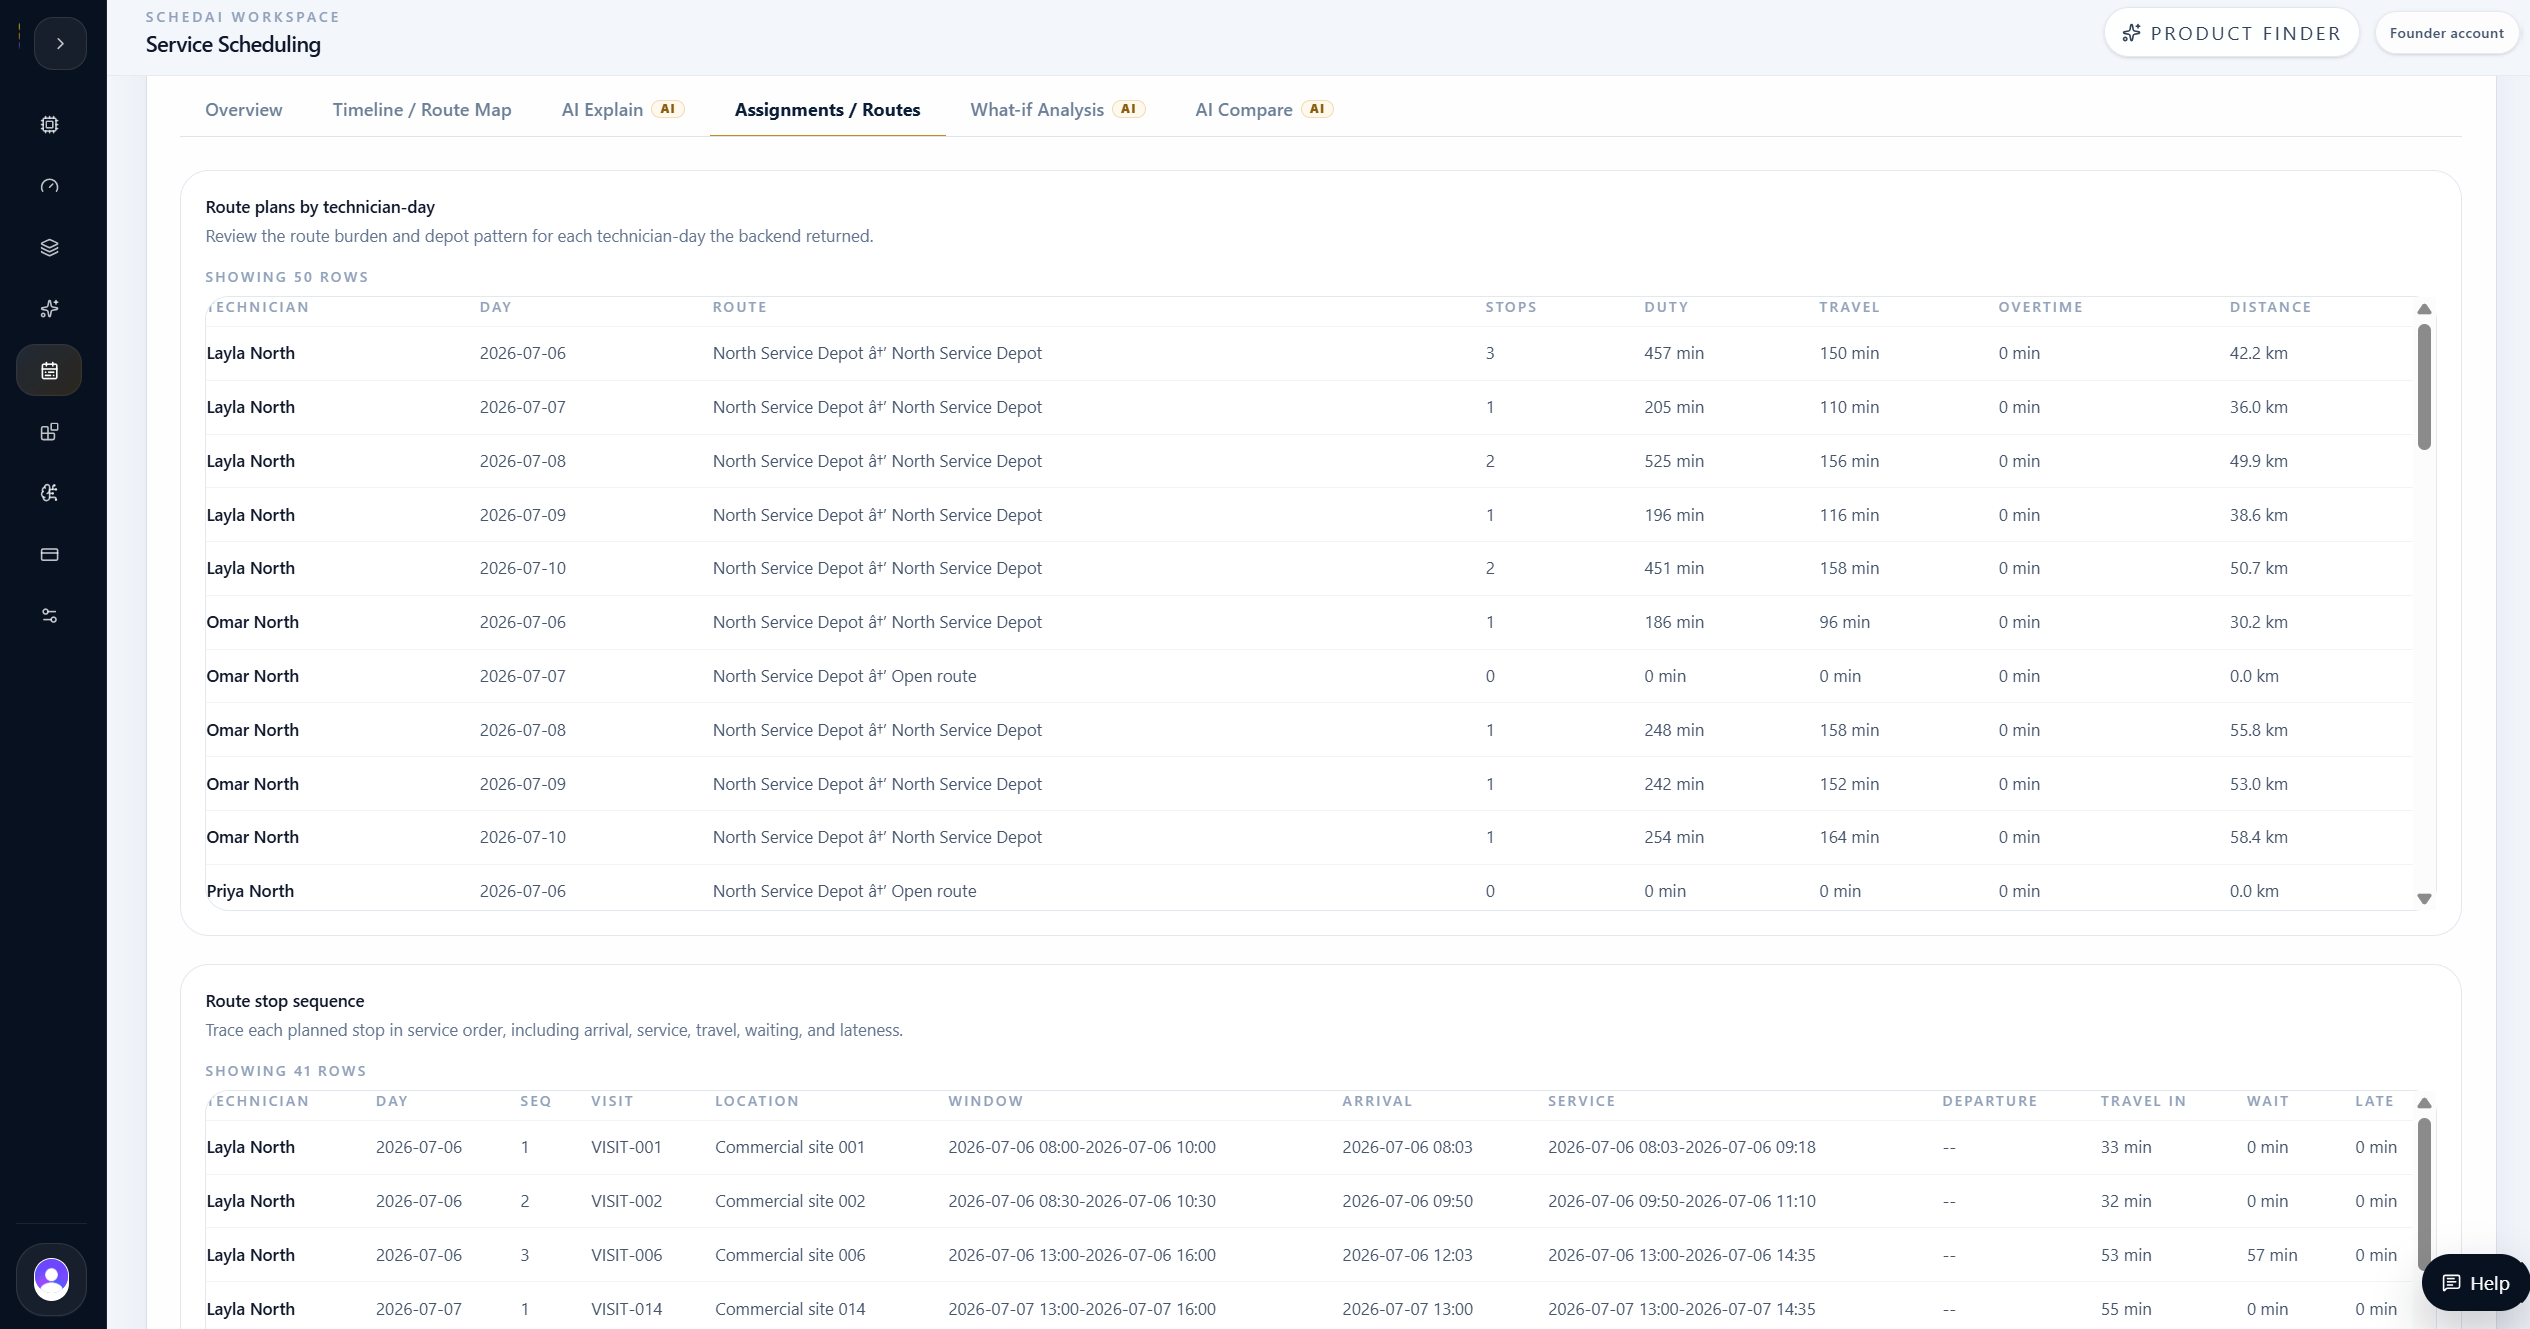
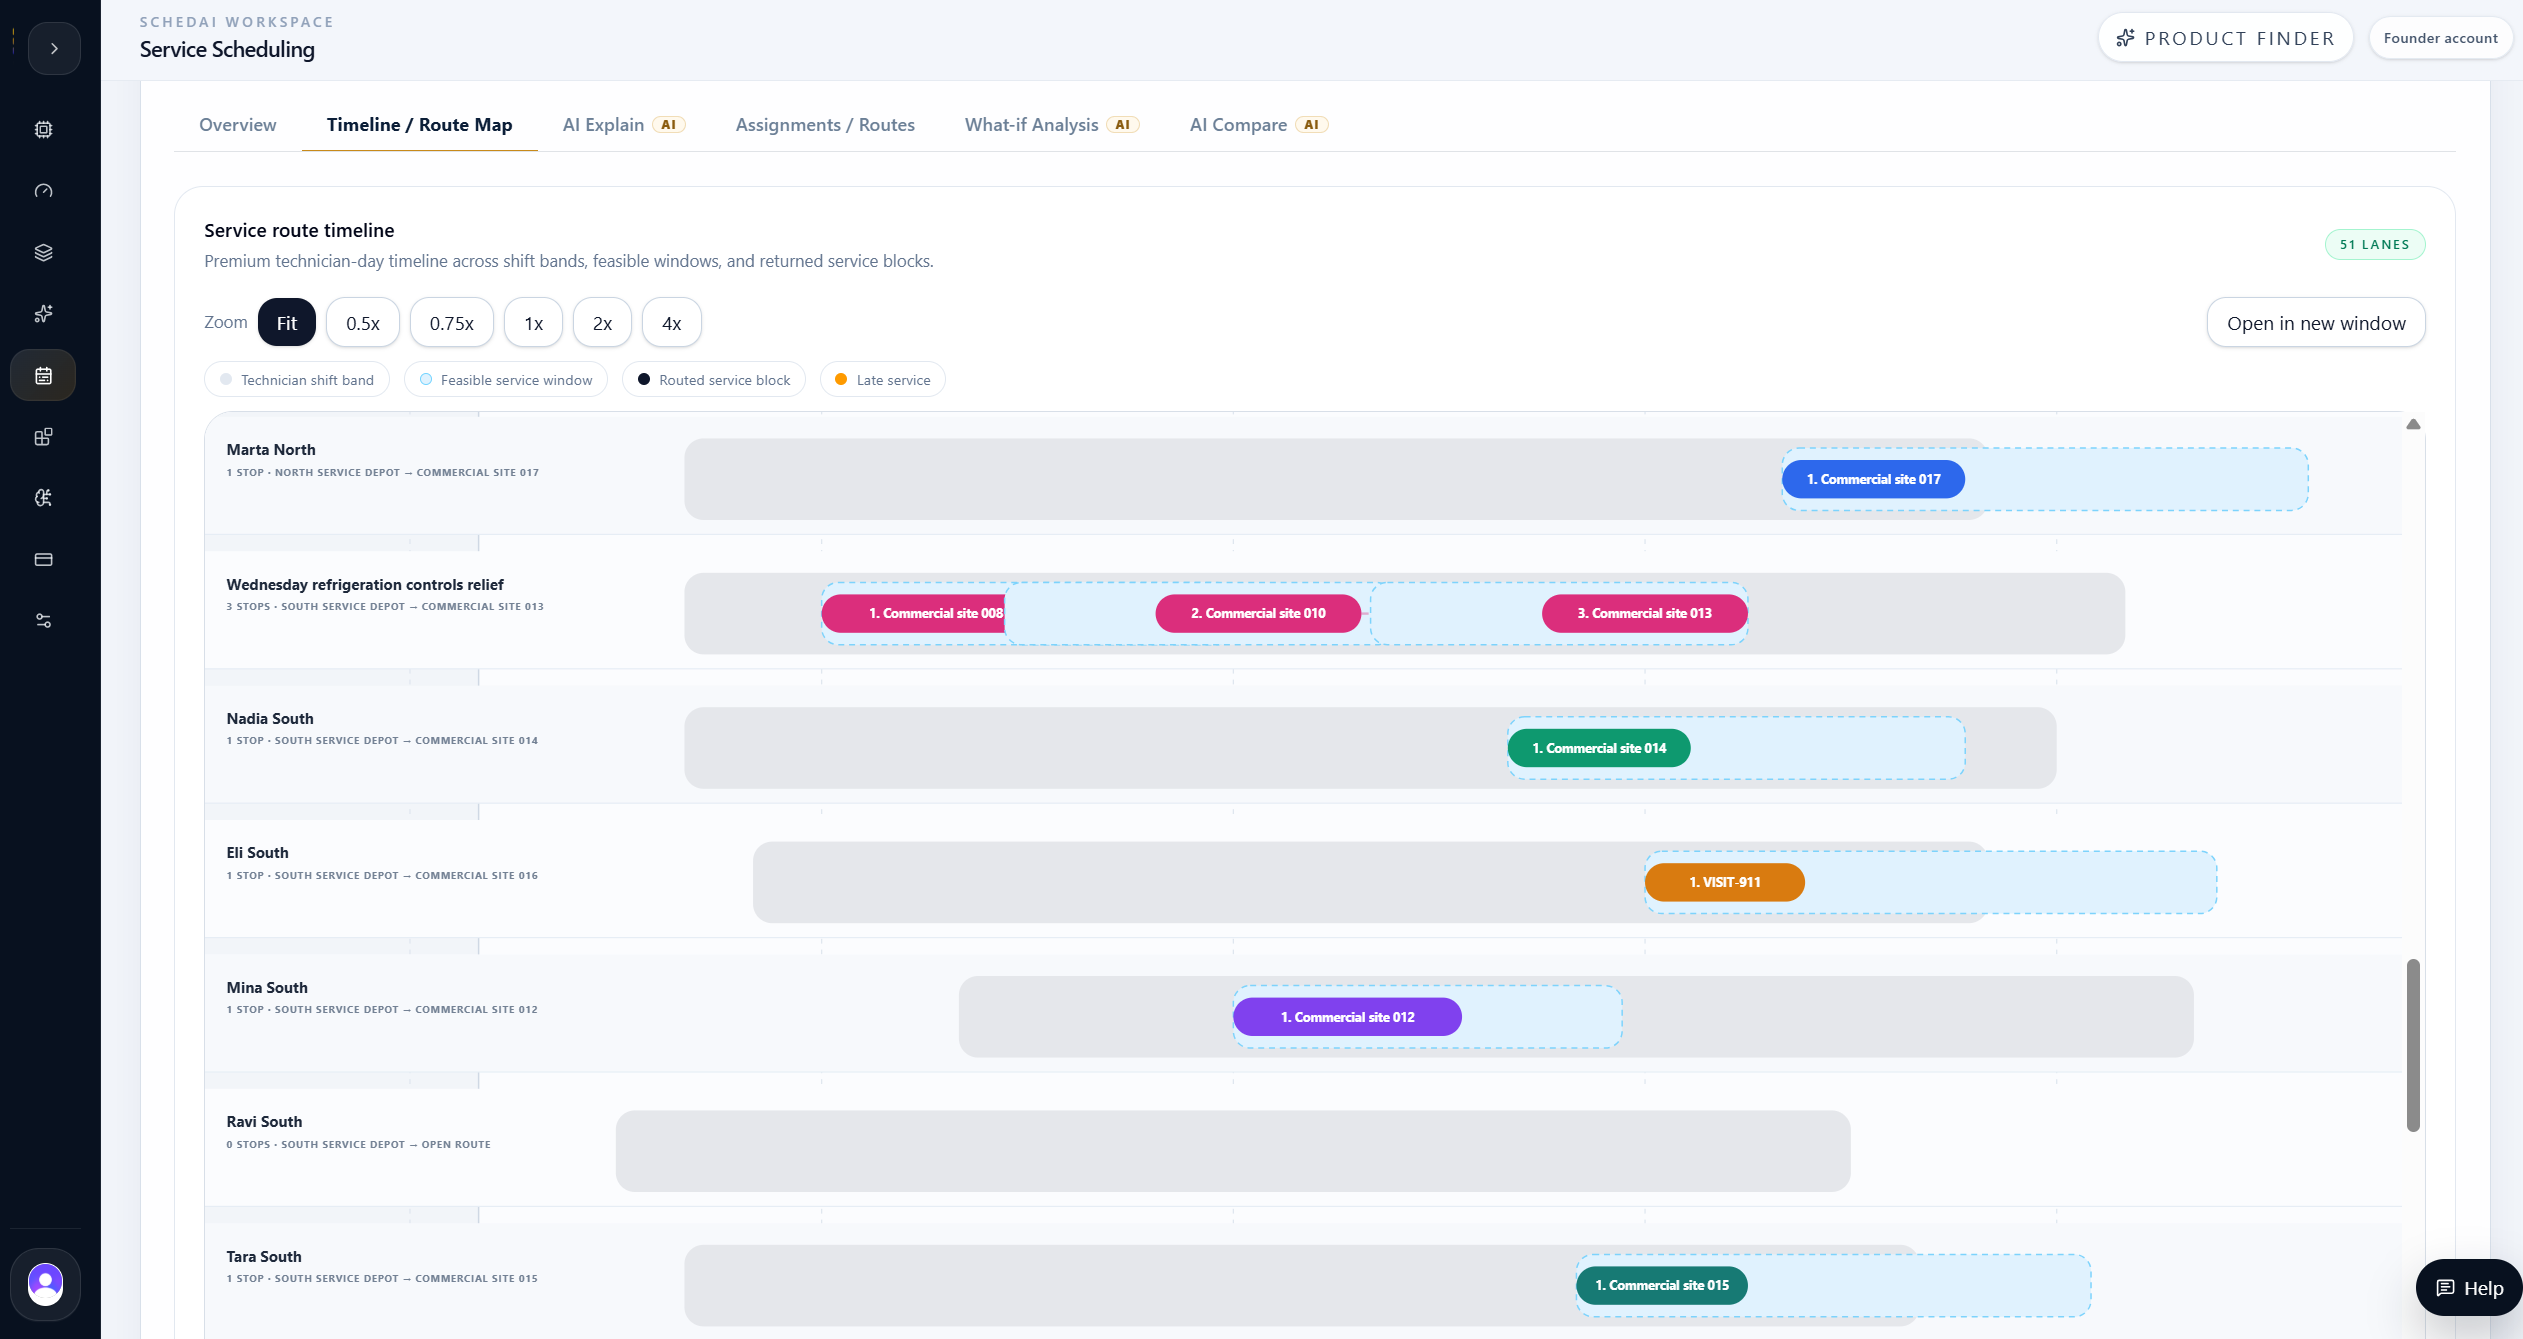
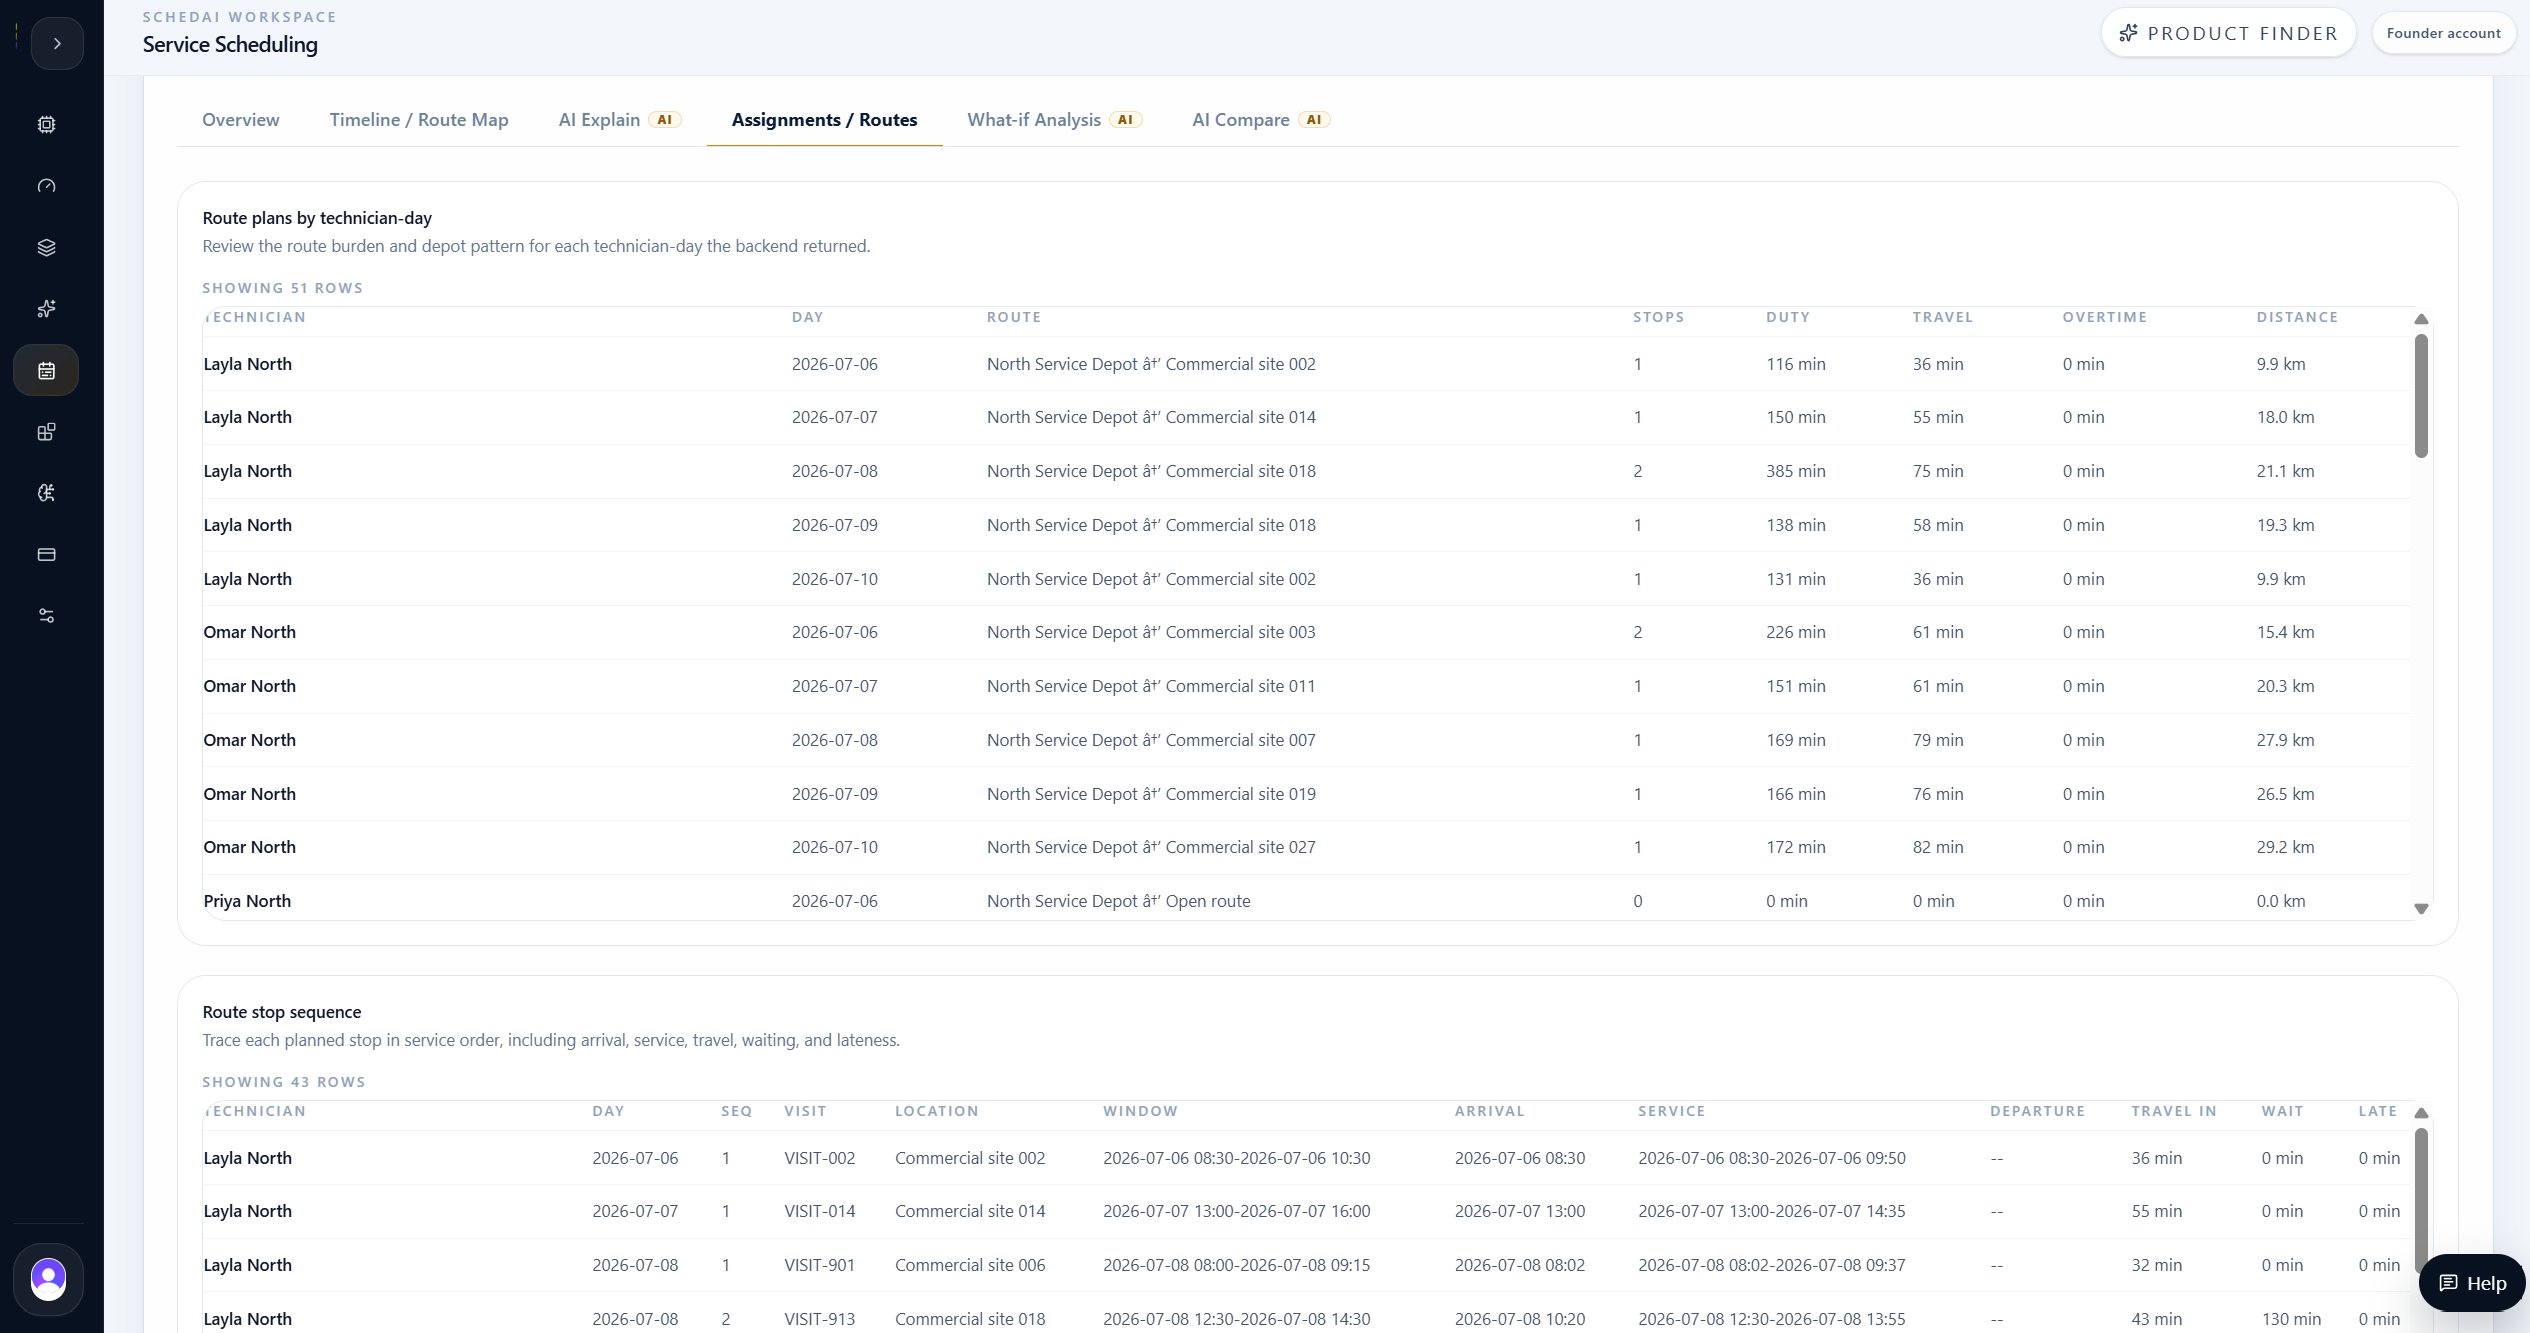
This step turned the uploaded CSV bundle into a reviewable dispatch result rather than a static plan. The team could inspect KPIs, timeline, route map, assignments, route stops, and AI-supported explanations before making any real dispatch decision.
Optimization model considered
- Technician skill eligibility
- Depot-to-customer travel time
- Customer-to-customer travel time
- Appointment windows
- Service durations
- Mandatory and priority visits
- Duty, overtime, and route-end policy
Baseline Evidence
SchedAI produced a feasible plan with visible service gaps.
| Baseline KPI | Value |
|---|---|
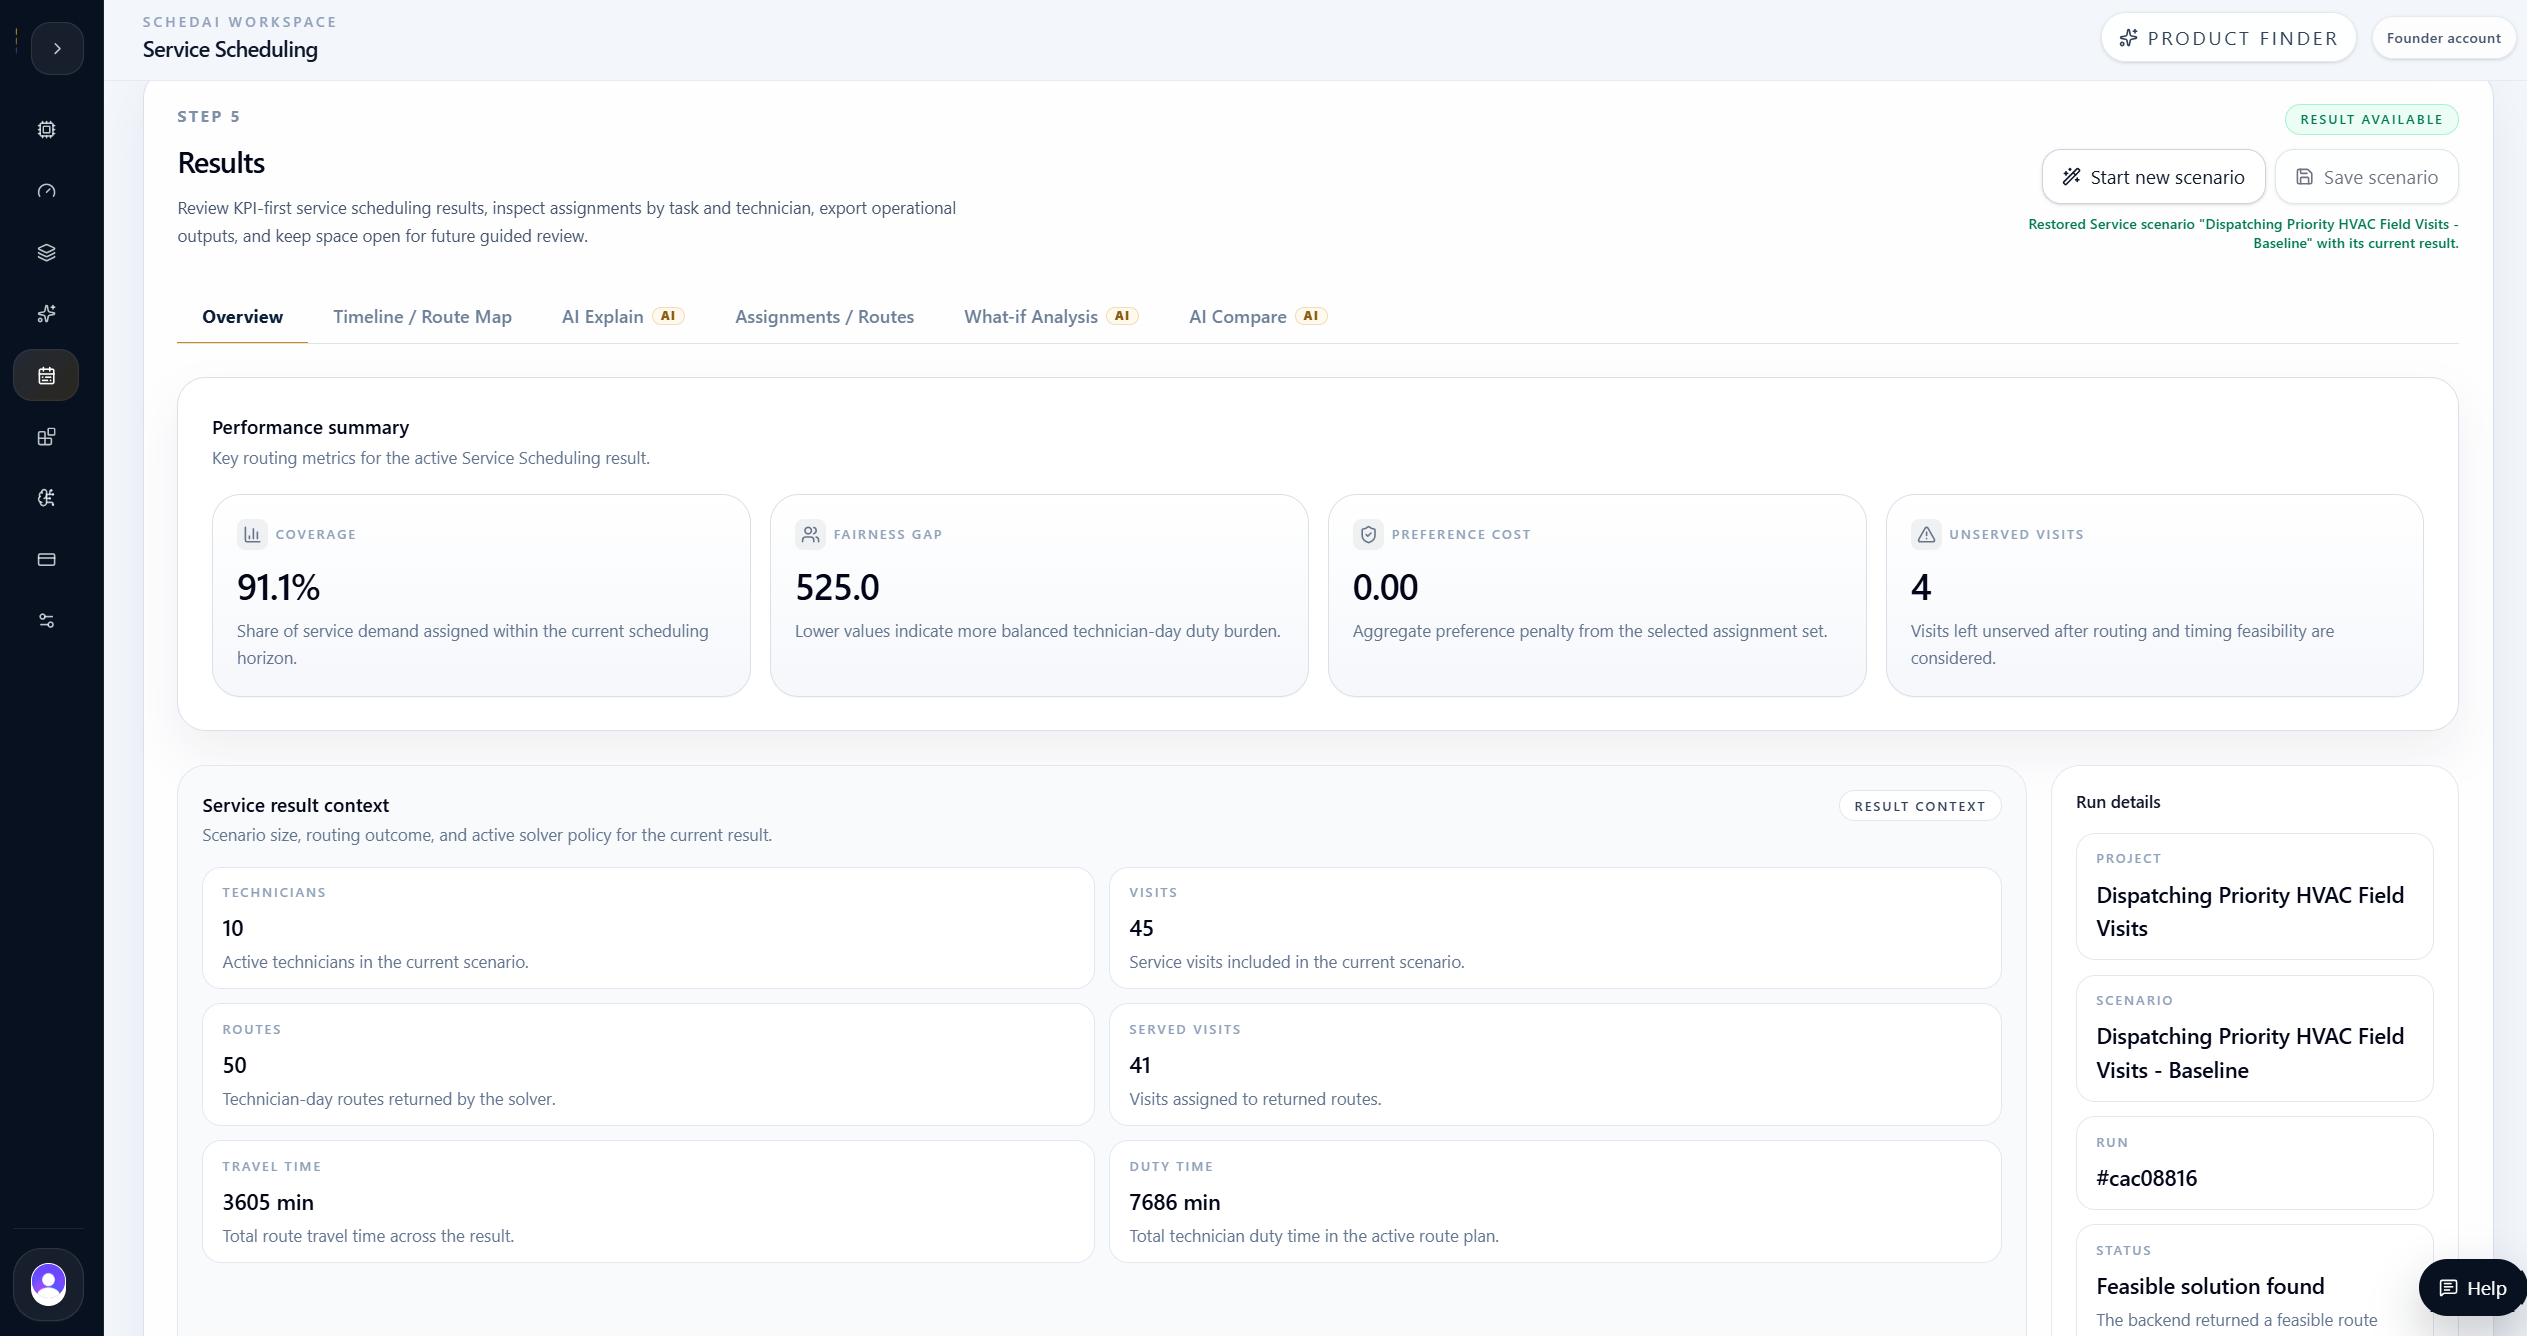
| Coverage | 91.1% |
| Served visits | 41 / 45 |
| Unserved visits | 4 |
| Mandatory unserved | 0 |
| Tardy visits | 1 |
| Tardiness | 5 min |
| Overtime | 23 min |
| Fairness gap | 525 min |
The baseline was feasible, but clearly pressured. SchedAI served 41 of 45 visits, reached 91.1% coverage, and left 4 visits unserved: VISIT-903, VISIT-904, VISIT-905, and VISIT-906.
The result also showed 5 minutes of tardiness and 23 minutes of overtime. Mandatory visits stayed covered, but the Wednesday refrigeration-and-controls cluster exposed a real service gap.
Those numbers made the case useful. The baseline was not a perfect 100% plan. It gave the team a realistic starting point for asking whether a targeted operational change could improve coverage, remove lateness and overtime, and reduce route burden.
AI Explain
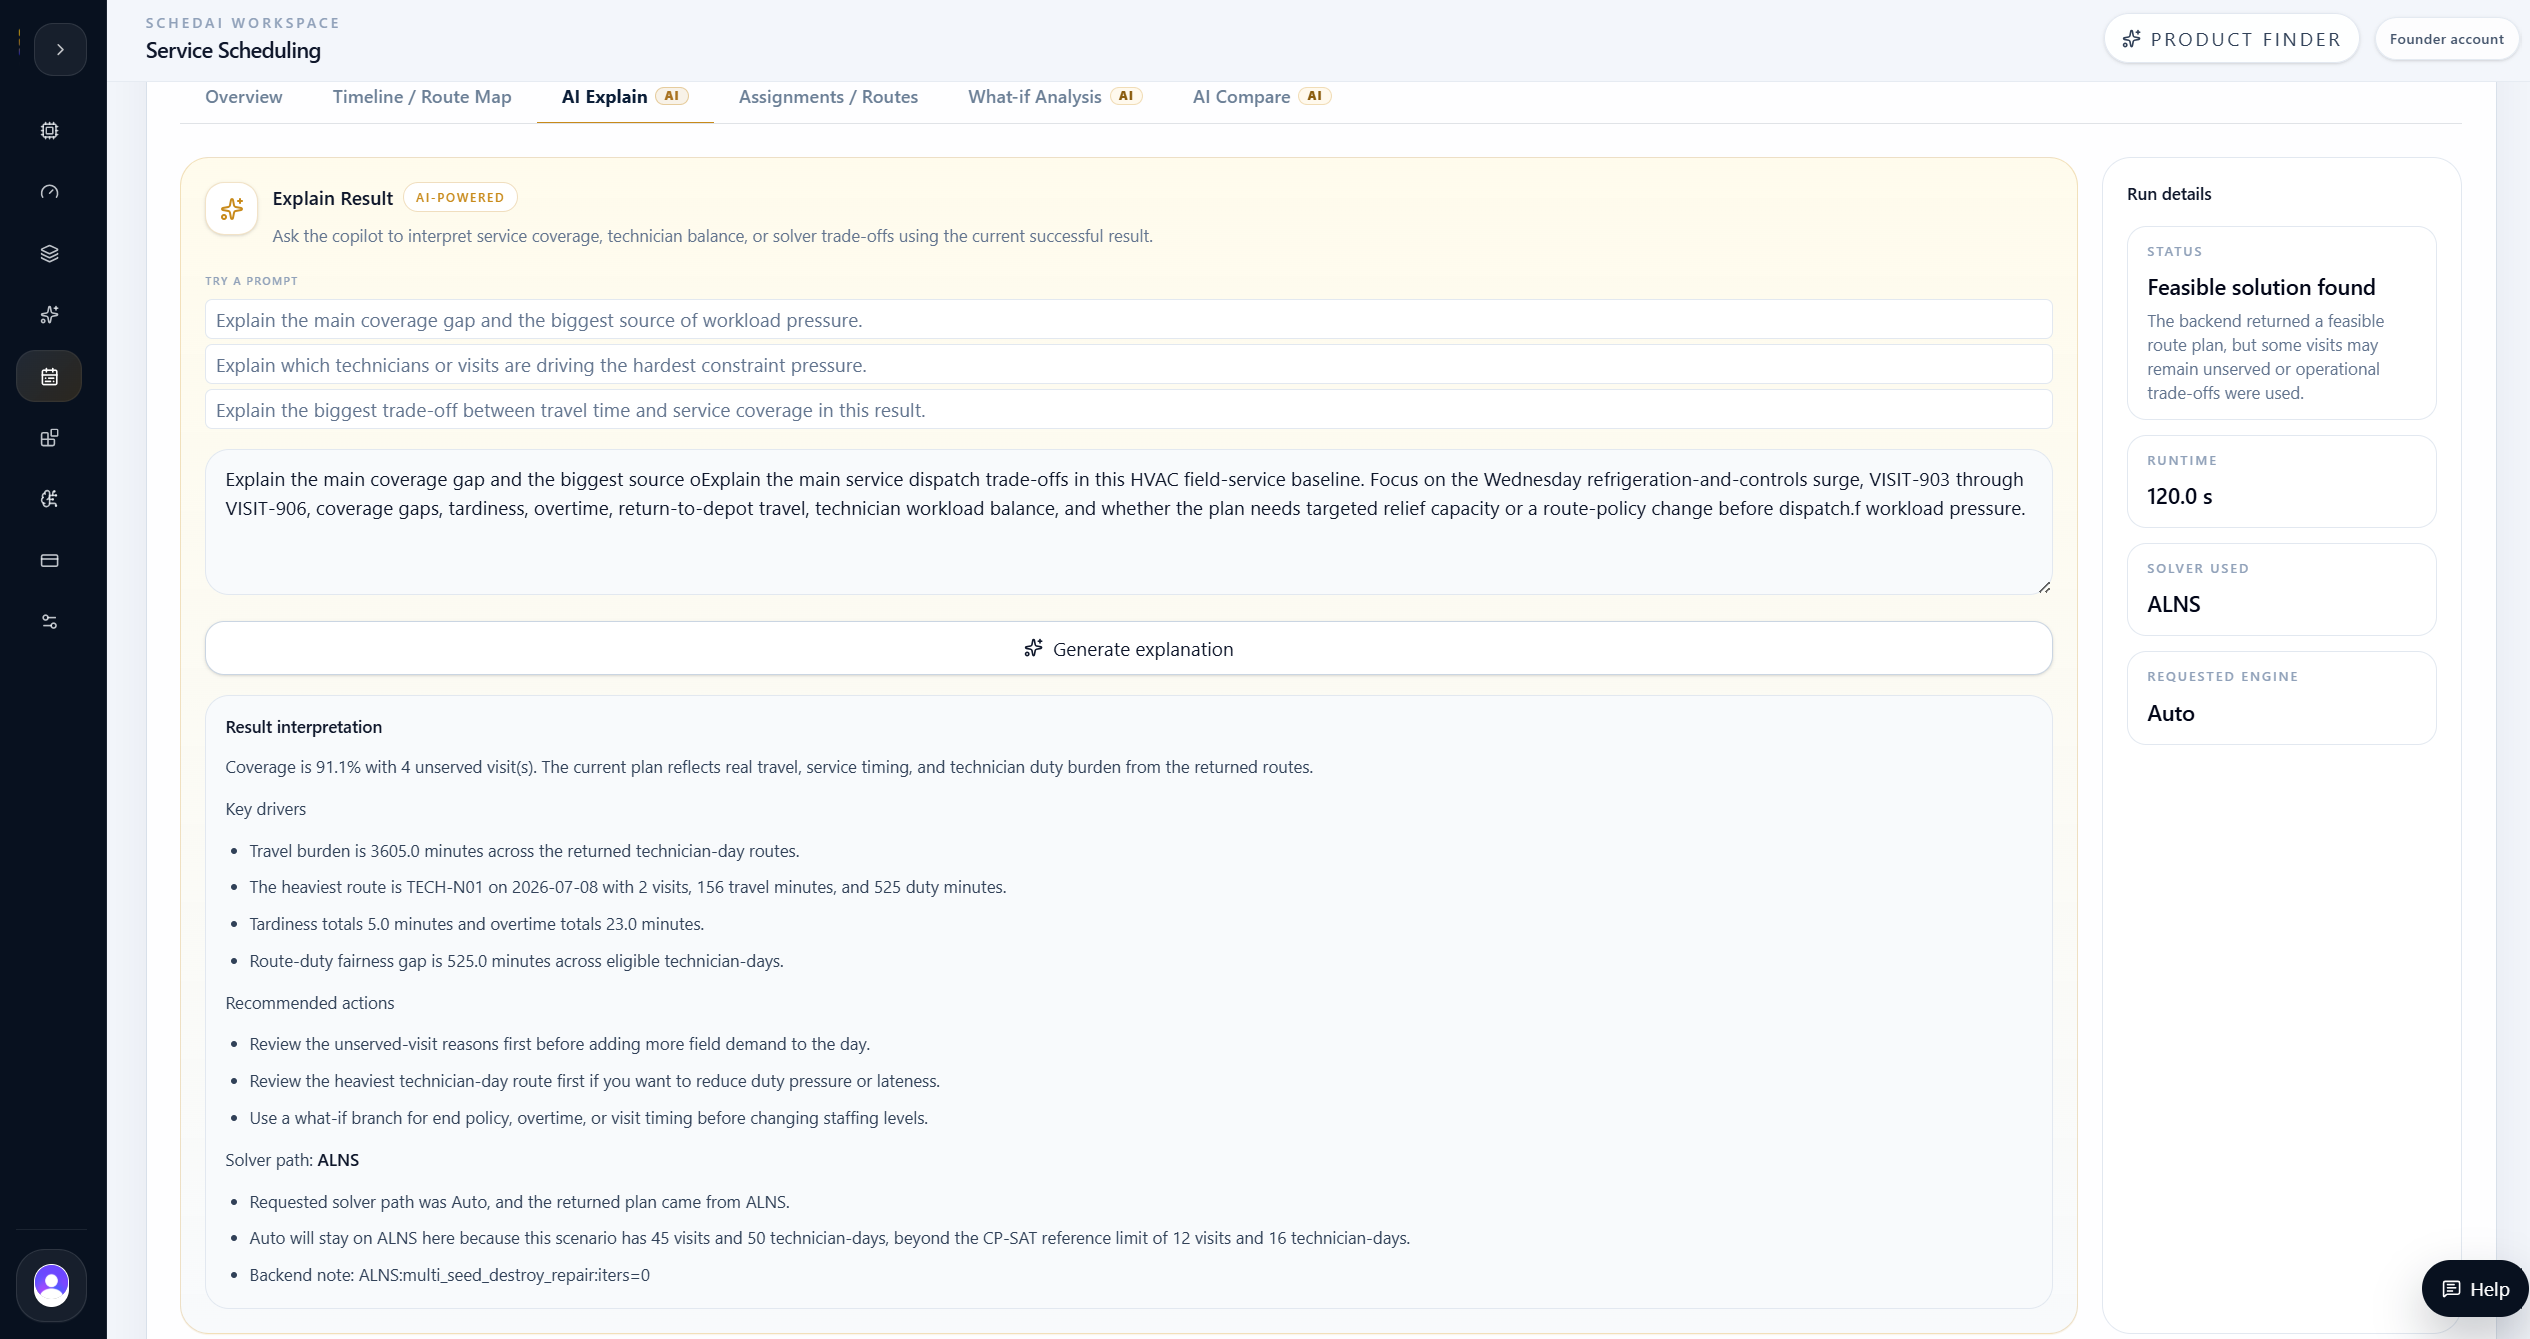
AI Explain identified the Wednesday refrigeration-and-controls bottleneck.
After reviewing the baseline, the team used AI Explain to interpret the service gaps and route pressure.
The explanation connected the remaining unserved visits to the Wednesday refrigeration-and-controls surge. The issue was not a general lack of work or a random calendar gap; it was a concentrated skill-and-window bottleneck around a set of specialized visits.
That turned the next step into a practical recovery question. The team needed to know whether adding one cross-trained Wednesday technician and removing return-to-depot travel from the branch would improve the plan enough to justify the operational change.
What-if Analysis
The team tested one combined recovery branch.
What the branch changed
- Added TECH-RELIEF-WED for 2026-07-08 only.
- Gave the relief technician HVAC, controls, refrigeration, and diagnostics skills.
- Based the relief technician at DEPOT-SOUTH with a 08:00-18:30 shift.
- Changed route-end policy from return-to-depot to open route.
- Compared coverage, unserved visits, tardiness, overtime, travel, distance, and workload balance.
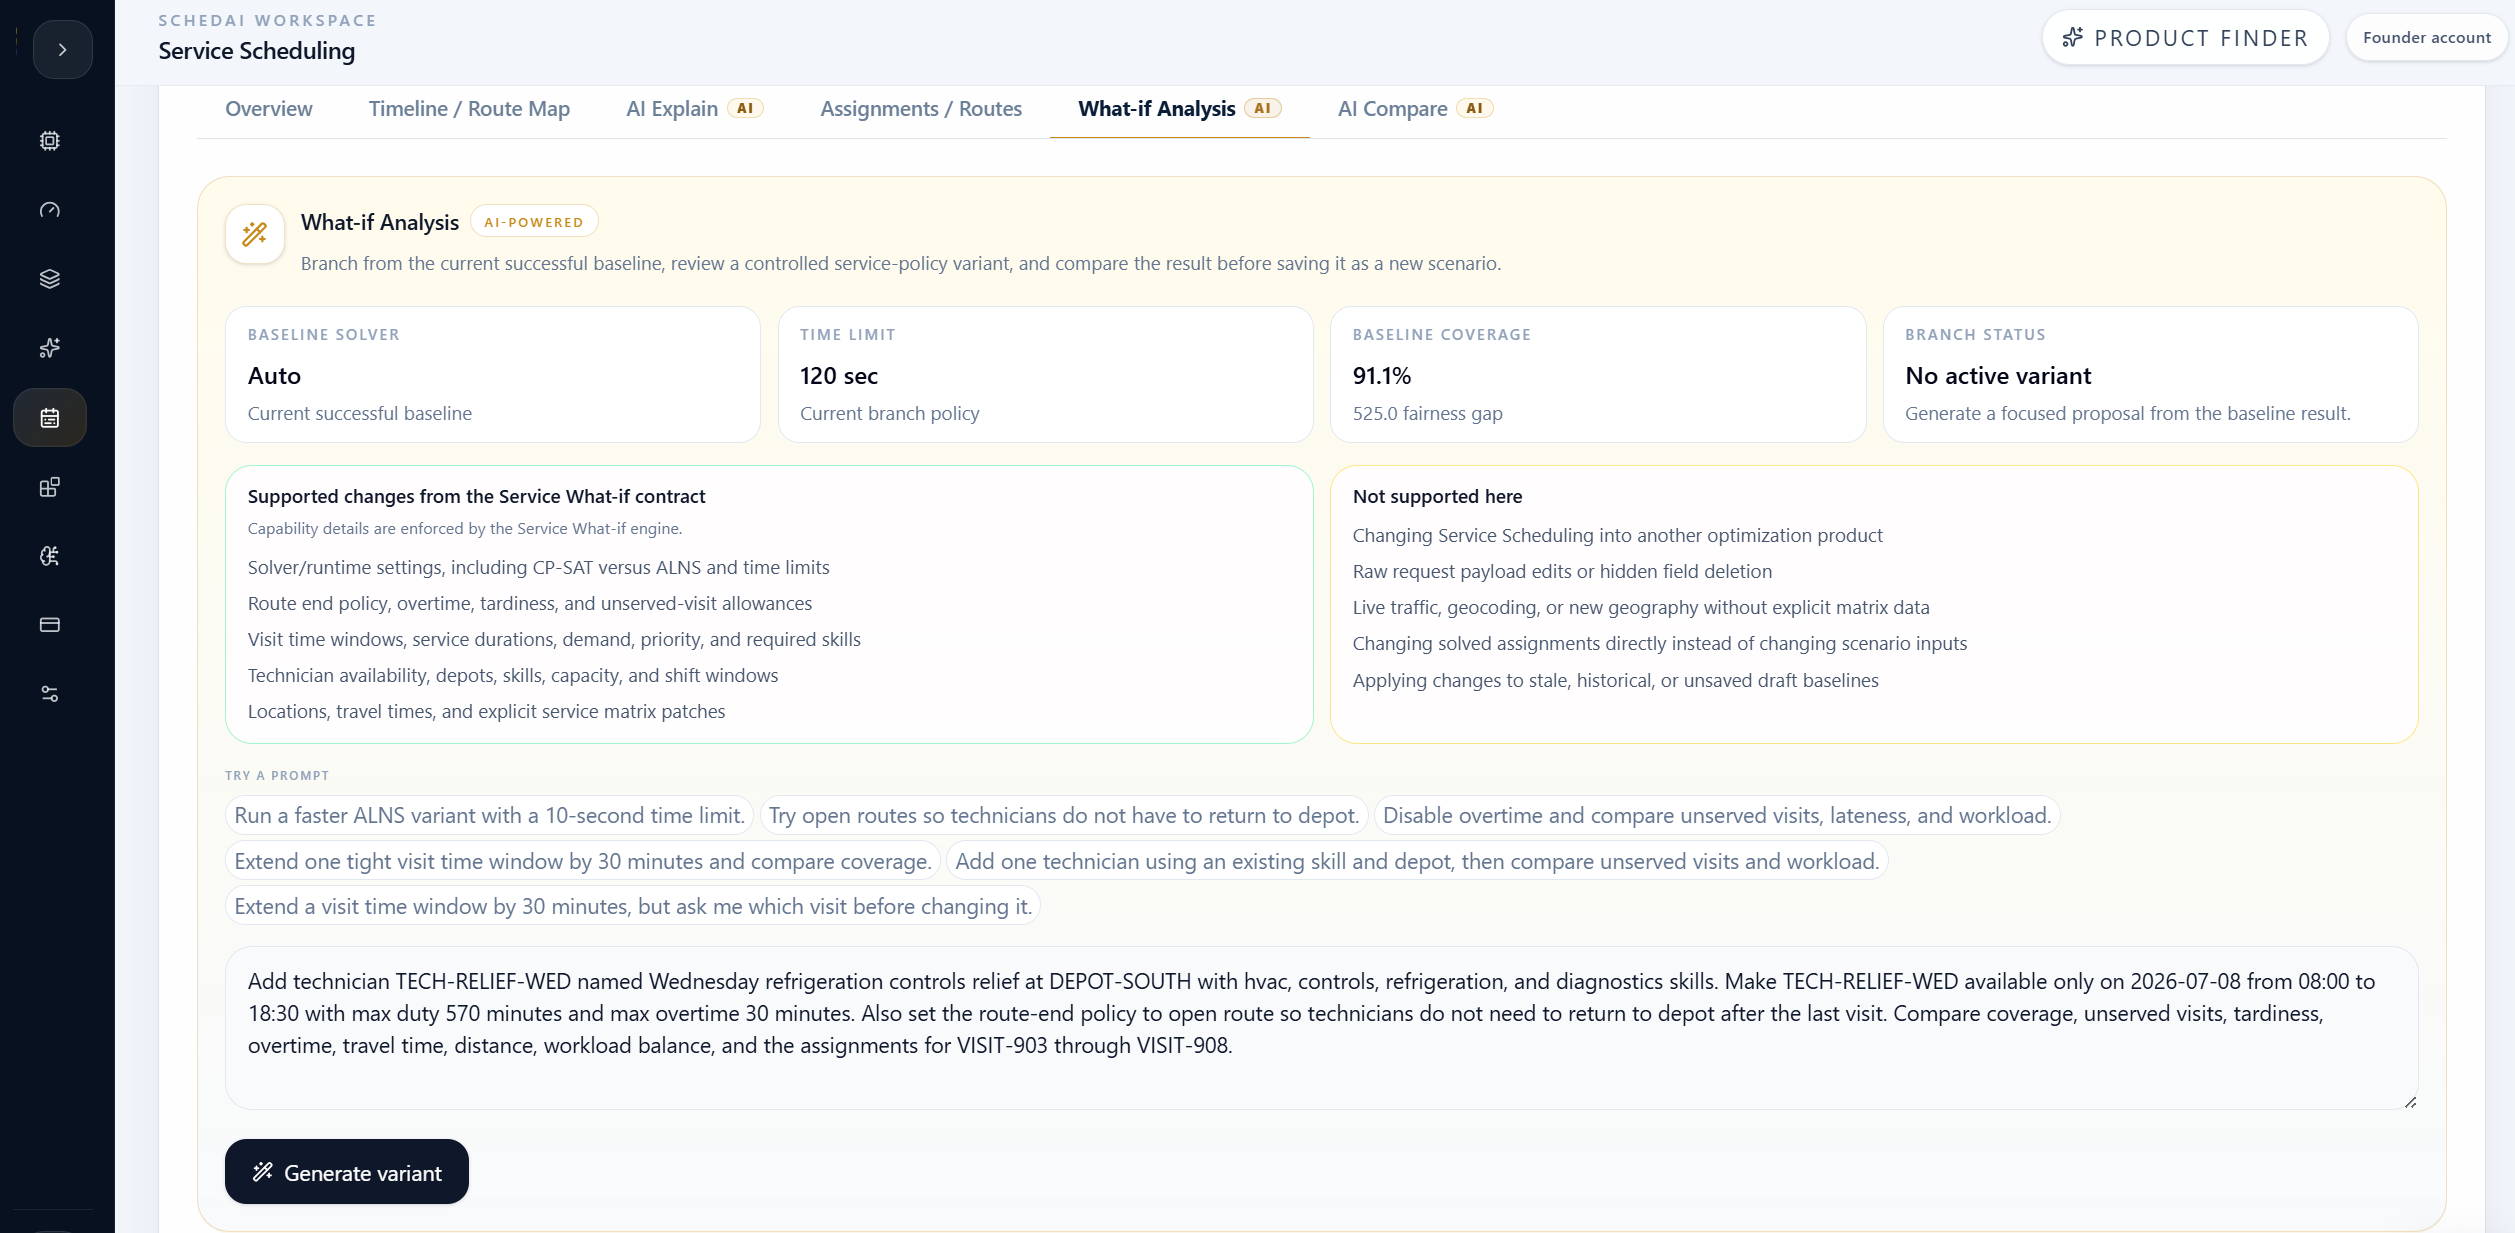
The team used What-if Analysis to test one combined recovery branch before changing the dispatch plan.
The branch added TECH-RELIEF-WED, a Wednesday-only technician based at DEPOT-SOUTH with HVAC, controls, refrigeration, and diagnostics skills. It also changed the route-end policy to open route, so technicians did not need to return to depot after the final visit in the branch.
This was a realistic service decision. Adding capacity alone could improve coverage but leave route burden high. Open routes alone could reduce travel but leave the skill bottleneck unresolved. The combined branch tested both changes together and then reran the optimizer.
Combined branch result
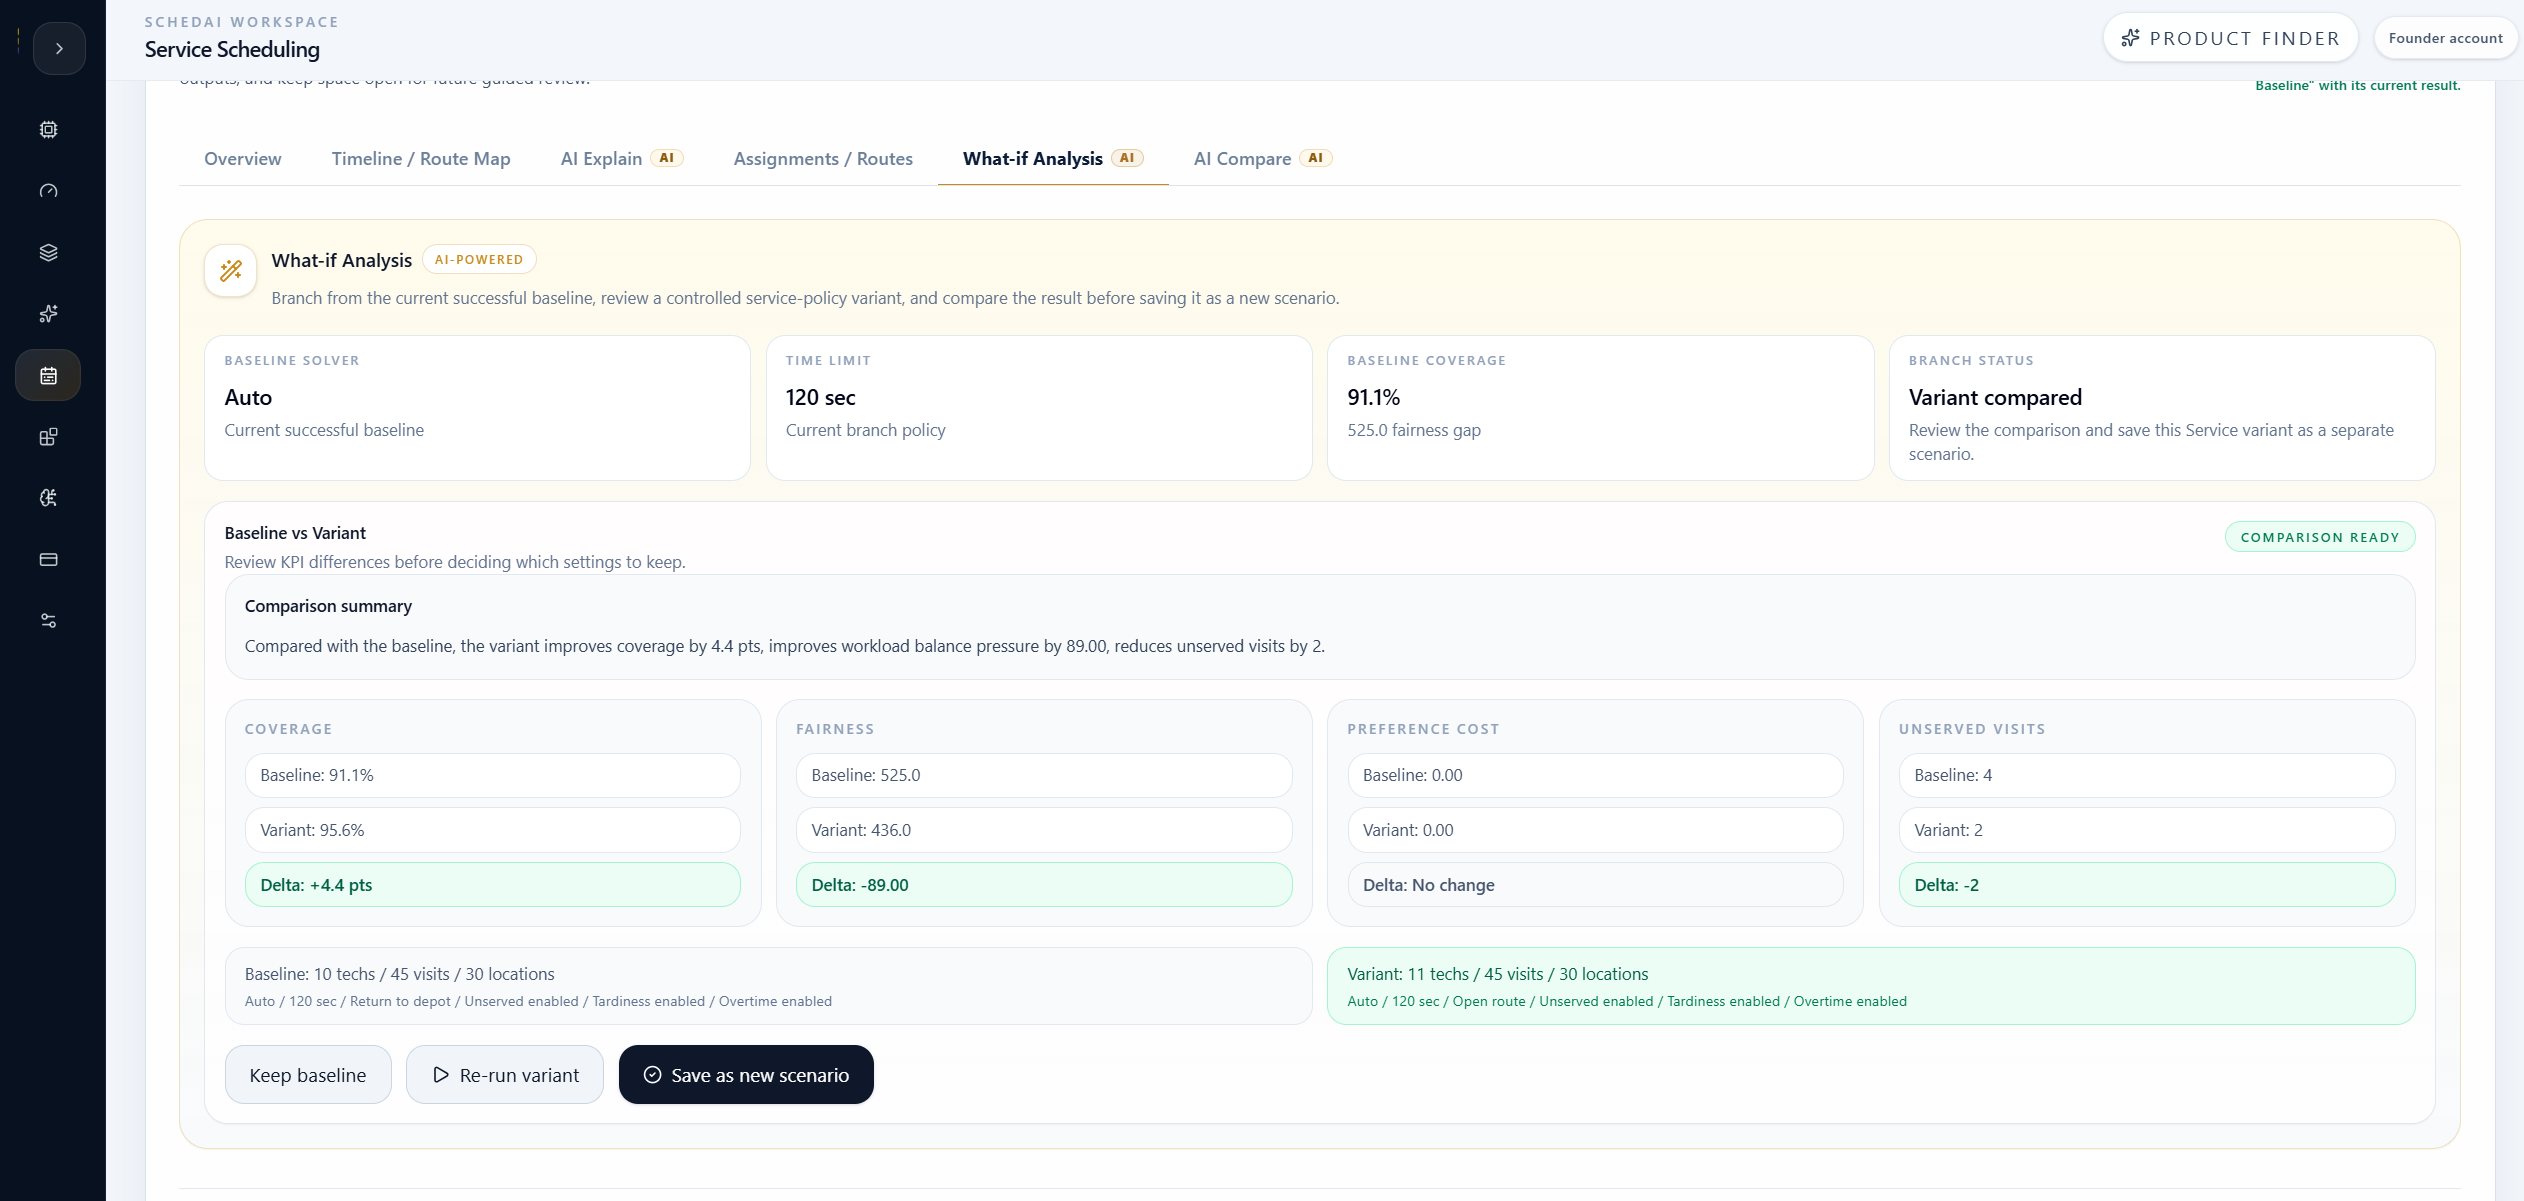
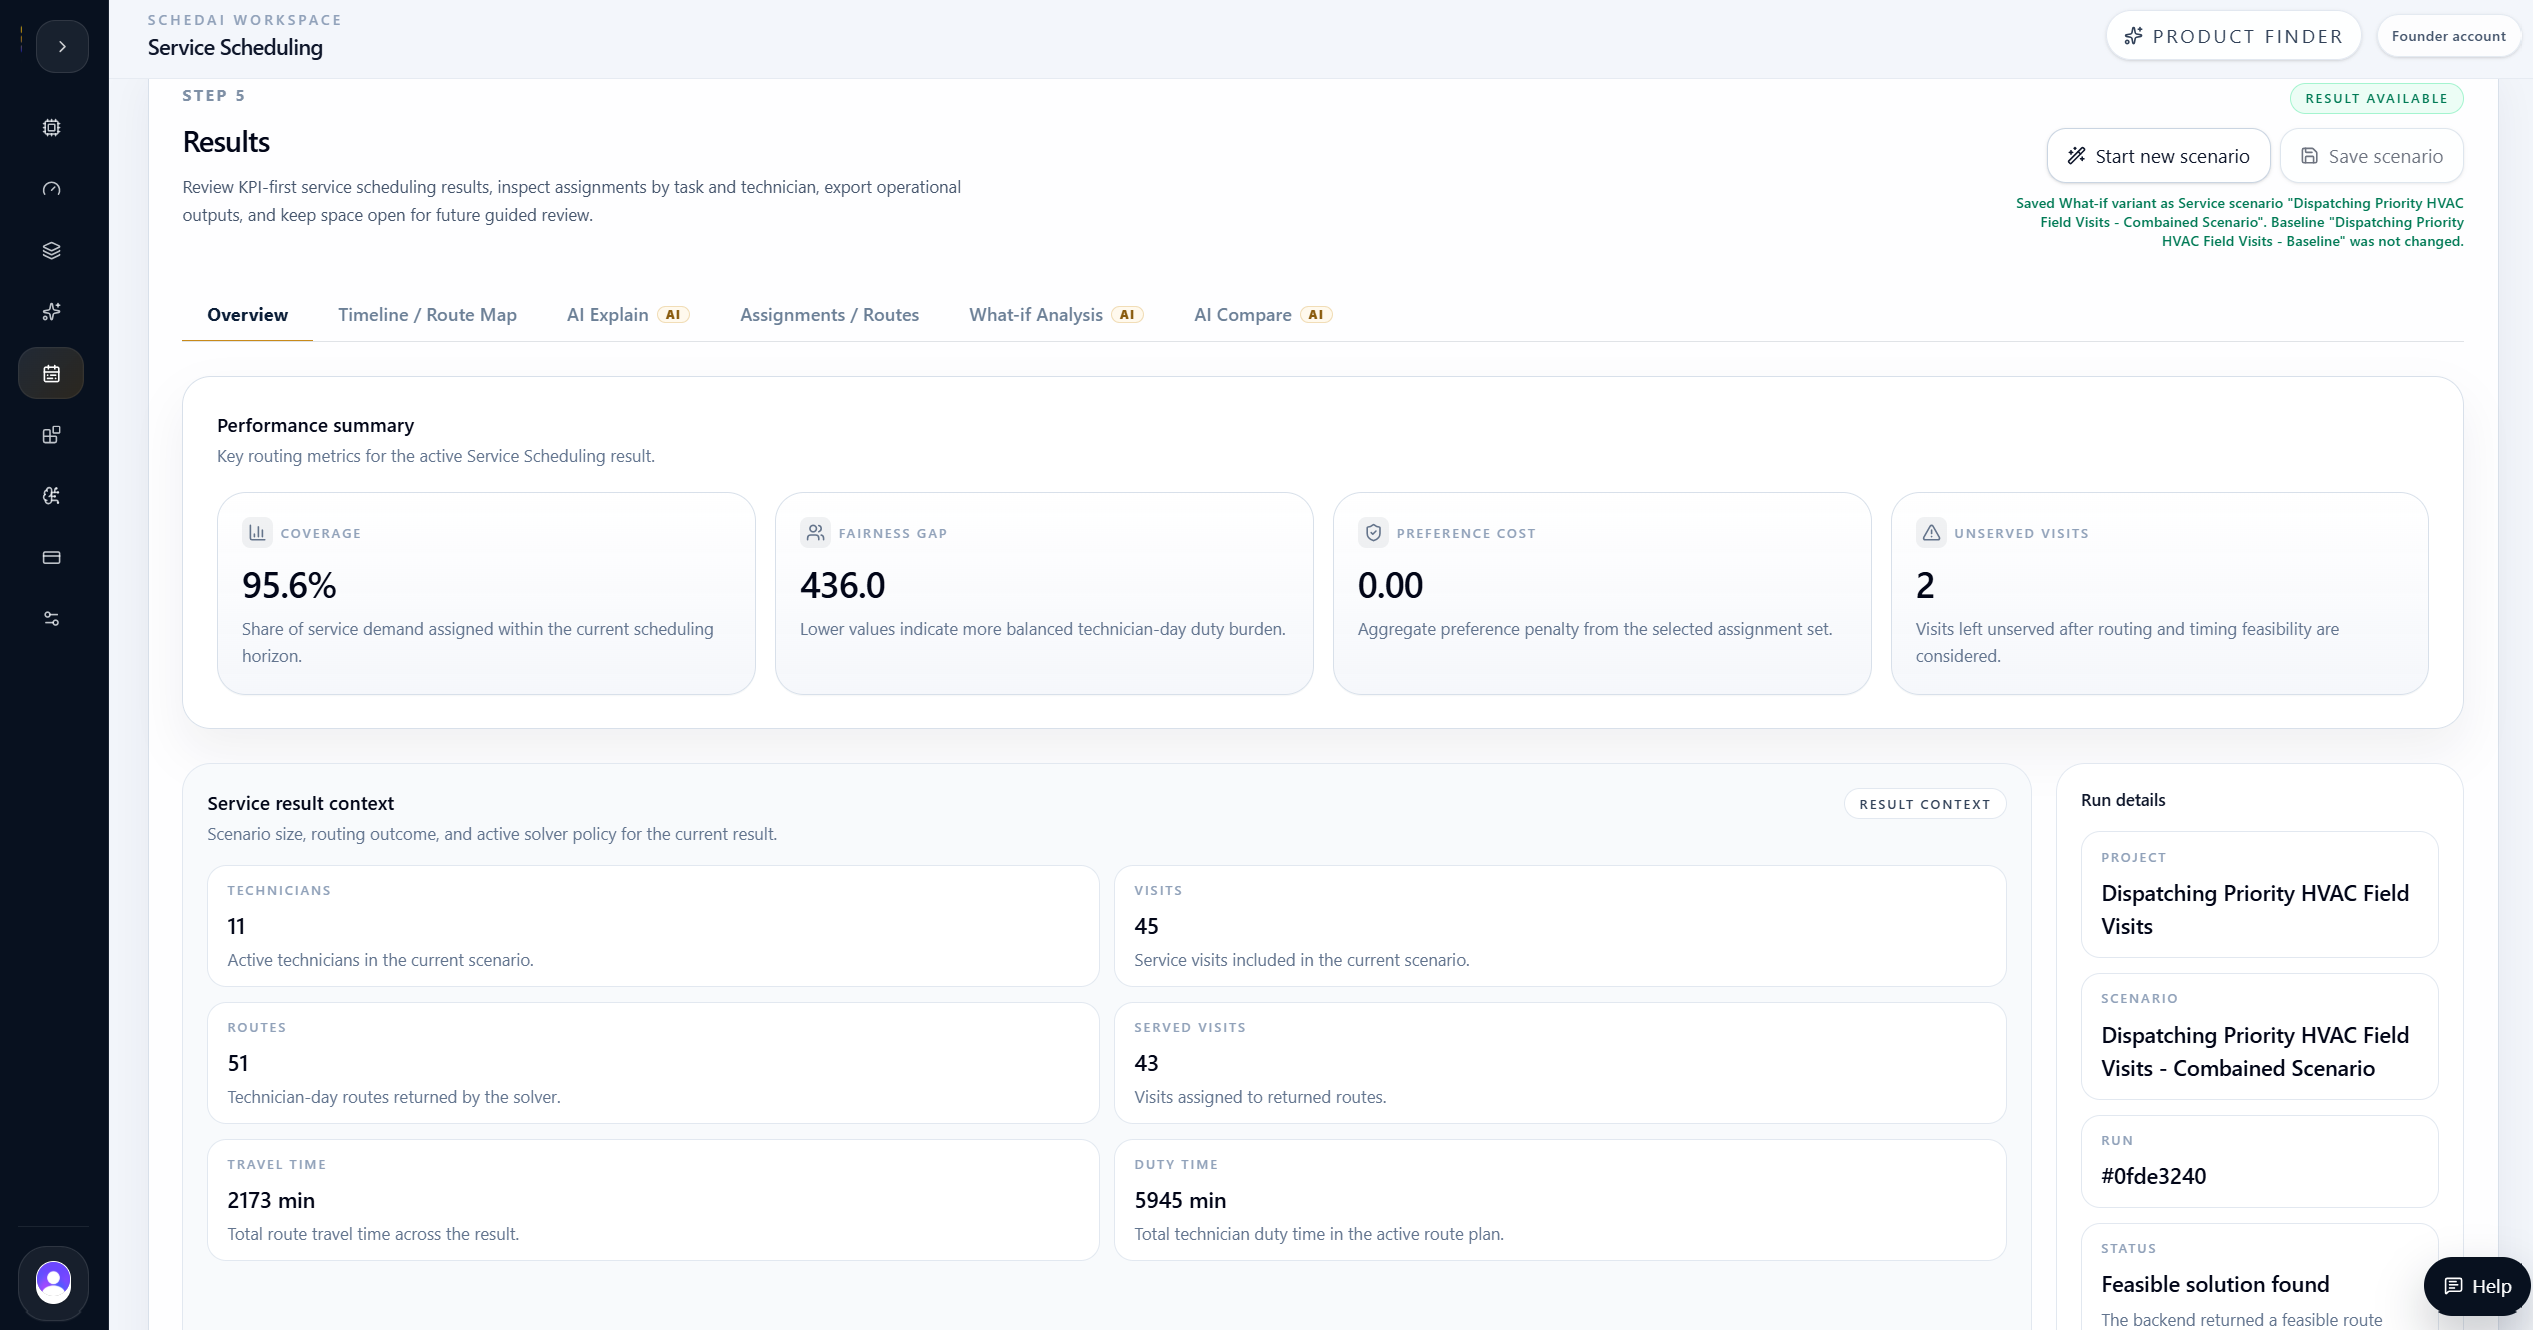
The combined branch improved the plan in the areas the team cared about most. Served visits increased from 41 to 43, coverage improved from 91.1% to 95.6%, and unserved visits dropped from 4 to 2.
The branch also removed the two clearest operational pain points: tardiness fell from 5 minutes to 0, and overtime fell from 23 minutes to 0.
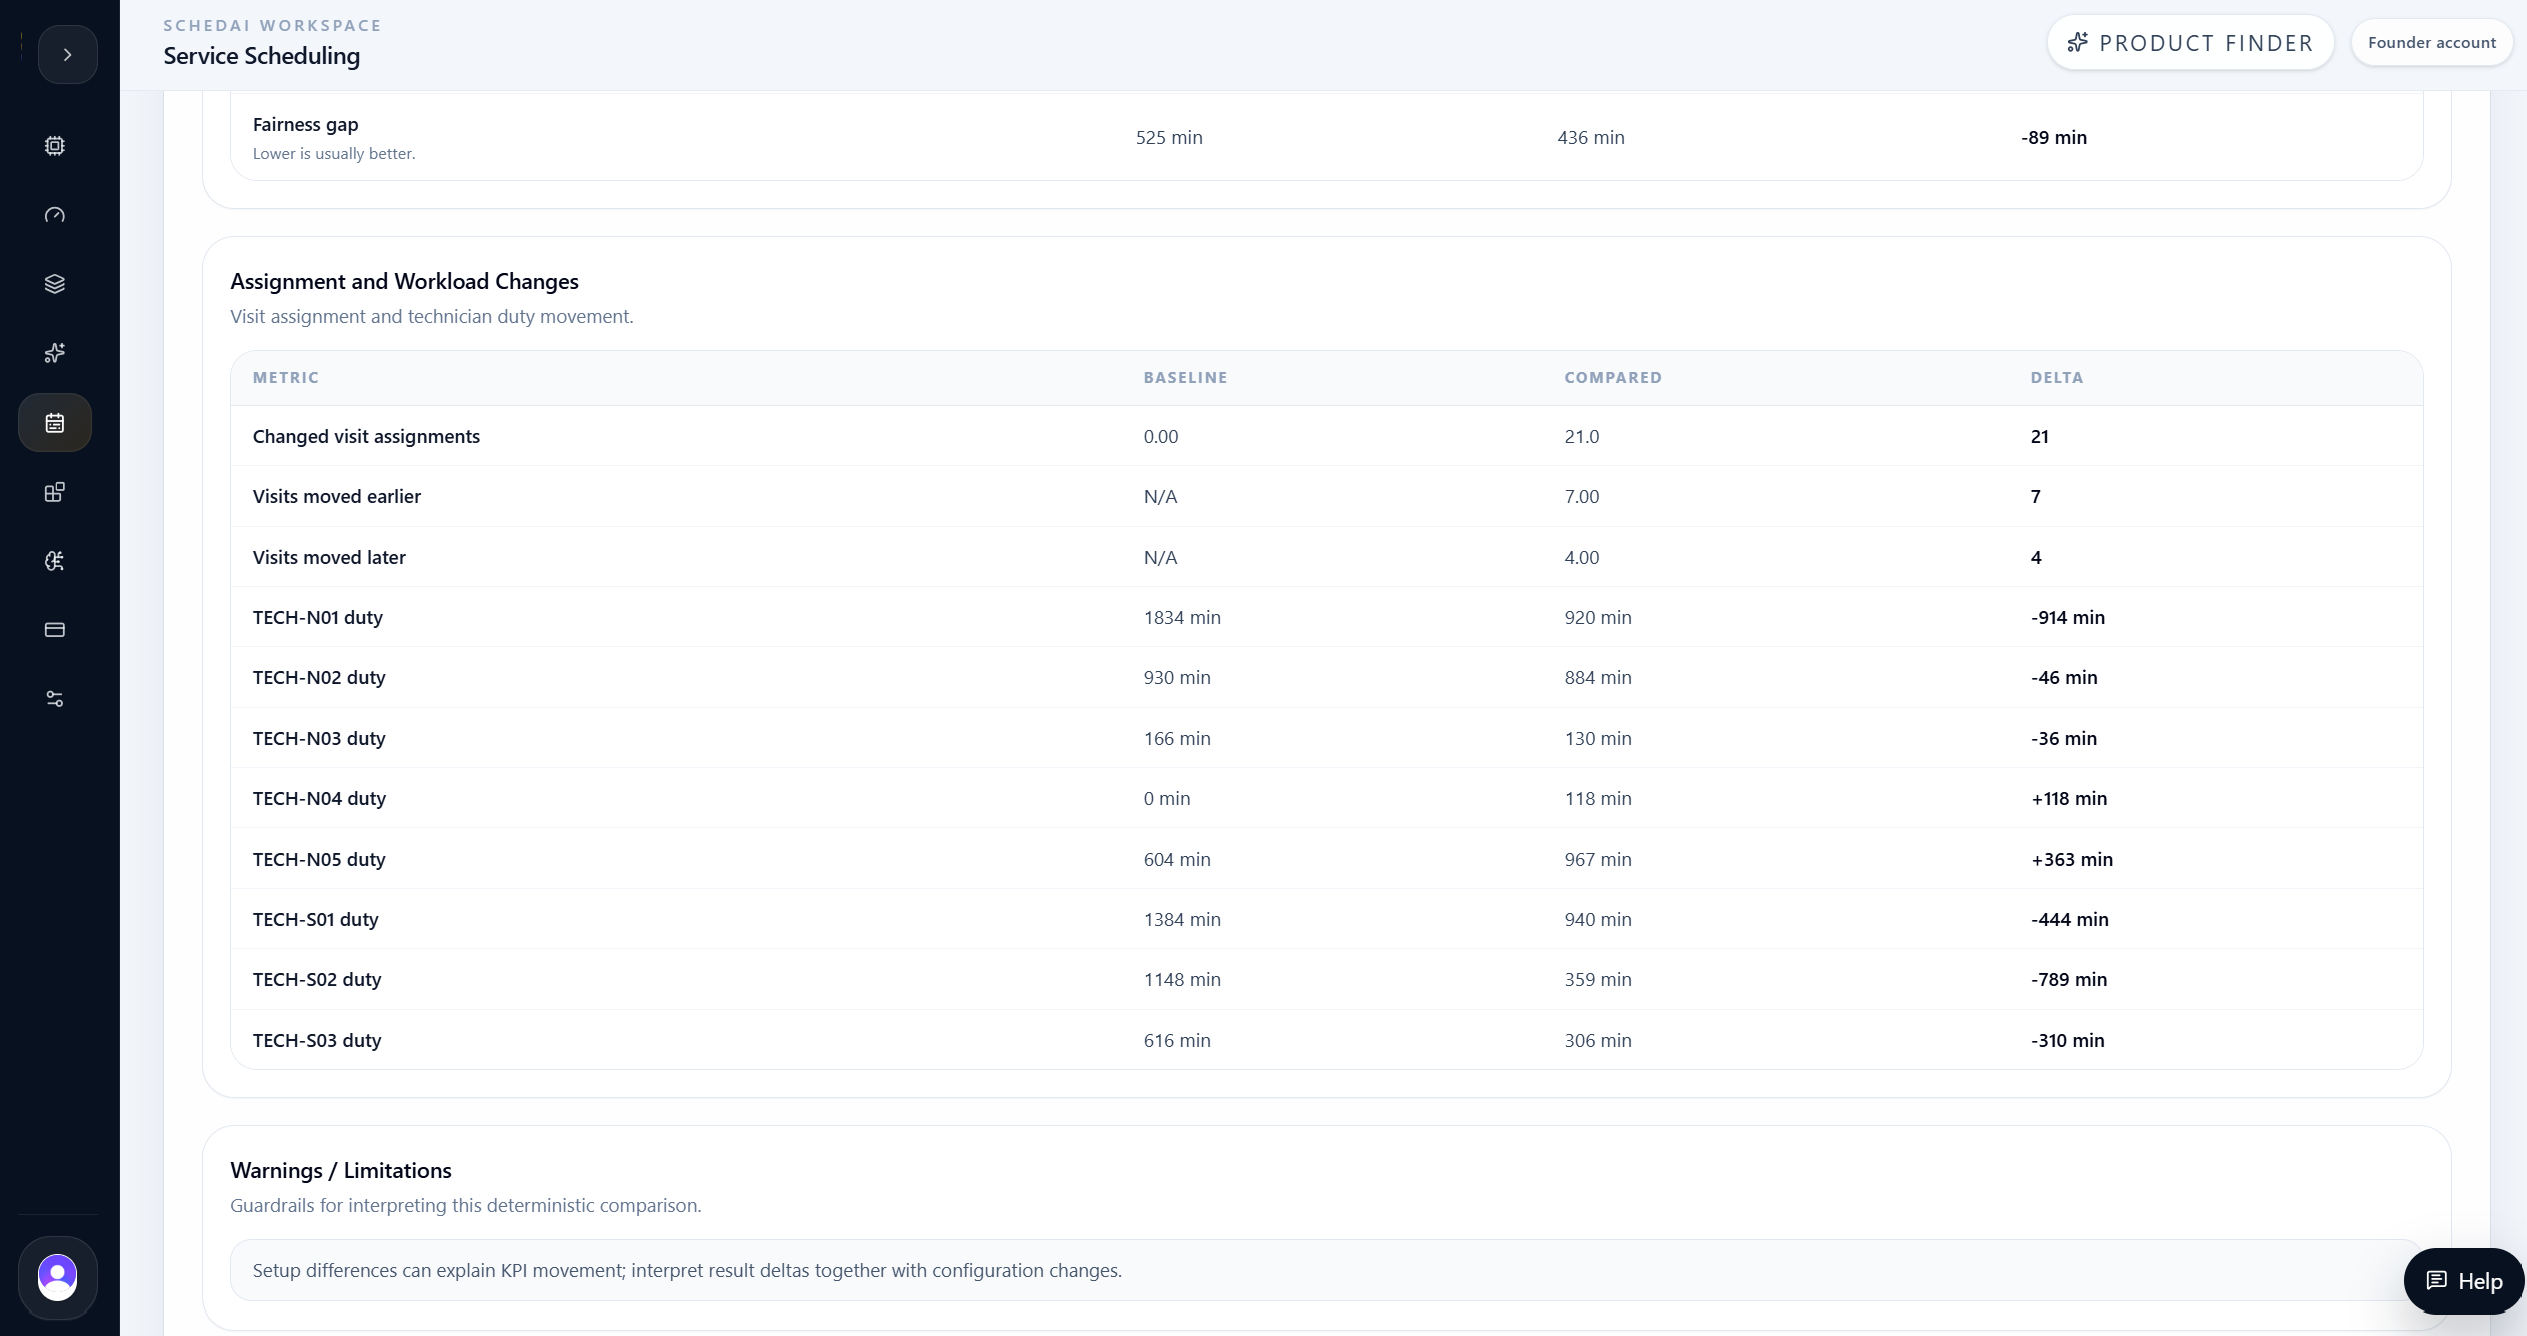
Because the branch used open routes, it also reduced route burden. Travel fell from roughly 3,708 minutes to roughly 2,173 minutes, distance fell from roughly 1,201.9 km to roughly 689.8 km, and the fairness gap improved from 525 minutes to 436 minutes.
| Metric | Baseline | Combined branch |
|---|---|---|
| Coverage | 91.1% | 95.6% |
| Served visits | 41 / 45 | 43 / 45 |
| Unserved visits | 4 | 2 |
| Tardy visits | 1 | 0 |
| Tardiness | 5 min | 0 min |
| Overtime | 23 min | 0 min |
| Travel time | about 3,708 min | about 2,173 min |
| Distance | about 1,201.9 km | about 689.8 km |
| Fairness gap | 525 min | 436 min |
AI Compare
AI Compare confirmed the combined branch was stronger.
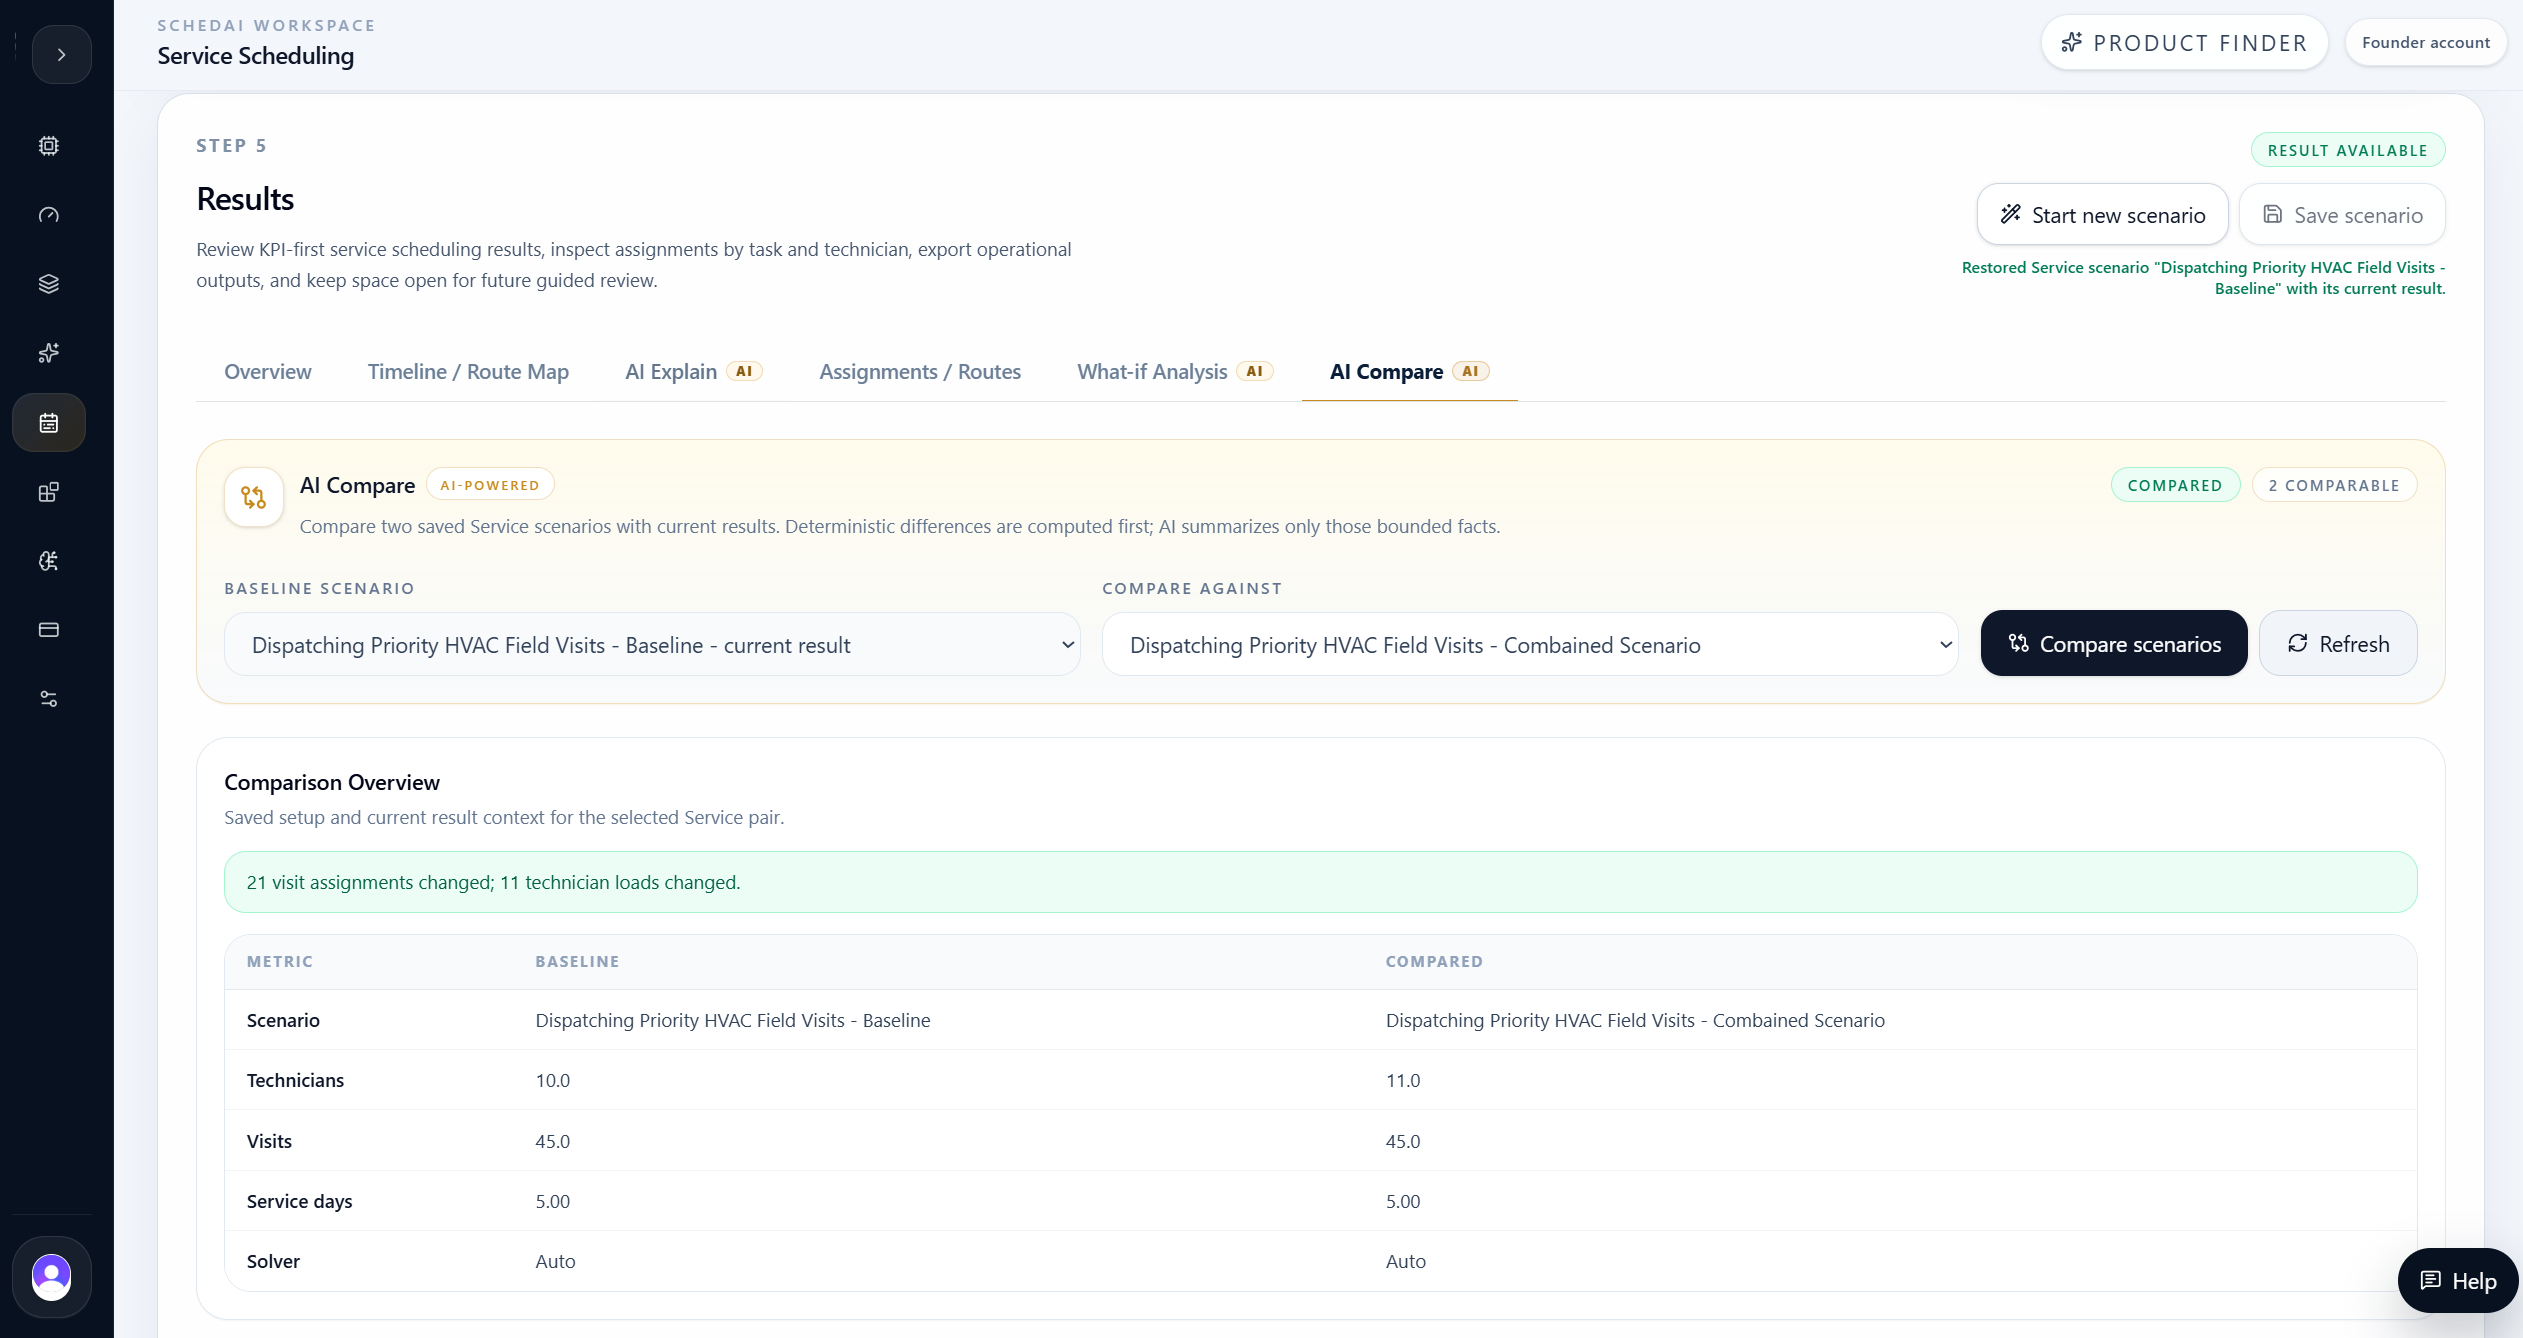
After the combined branch ran, the team used AI Compare to evaluate it against the original baseline.
The comparison showed the setup differences clearly: the combined branch added TECH-RELIEF-WED and changed route-end policy from return-to-depot to open route.
The KPI delta table confirmed that the branch was not only different, but better against the selected service objectives. Coverage improved, unserved visits dropped, tardiness disappeared, overtime disappeared, and travel burden fell sharply.
The assignment and workload comparison made the result concrete. The branch did not hide the decision inside a summary. It showed which service routes moved, how technician load changed, and how the added capacity helped absorb the Wednesday bottleneck.
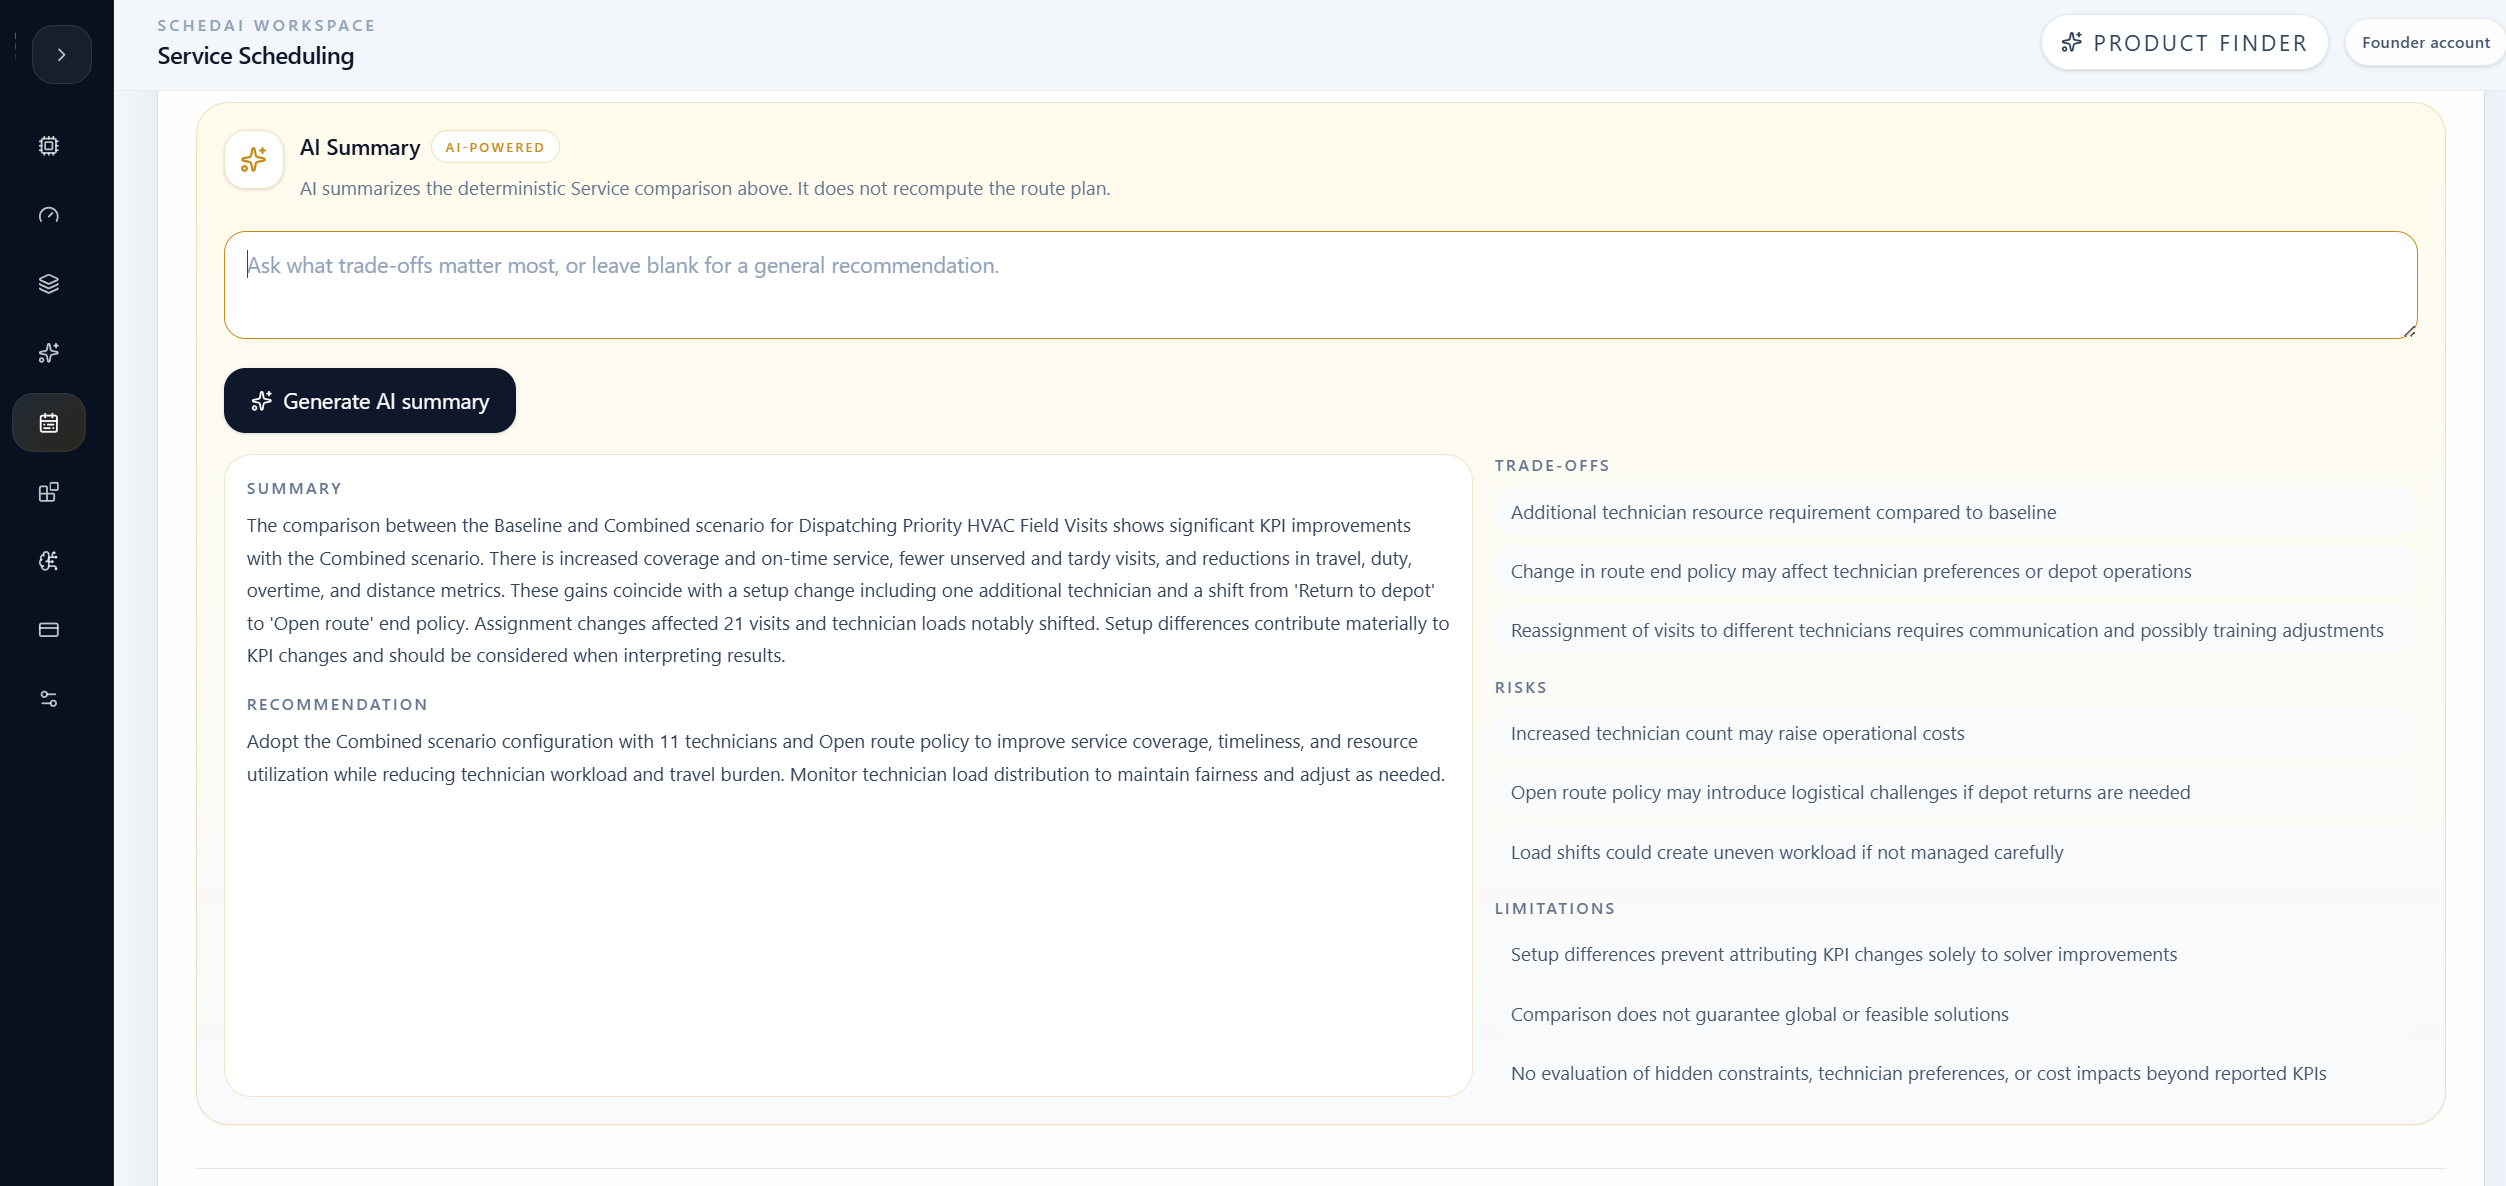
The AI Summary translated that evidence into a dispatch recommendation while preserving the caveat: two visits still remained unserved, so the branch was a strong recovery plan, not a complete service guarantee.
Coverage
Baseline: 91.1%
Combined: 95.6%
Unserved visits
Baseline: 4
Combined: 2
Overtime
Baseline: 23 min
Combined: 0 min
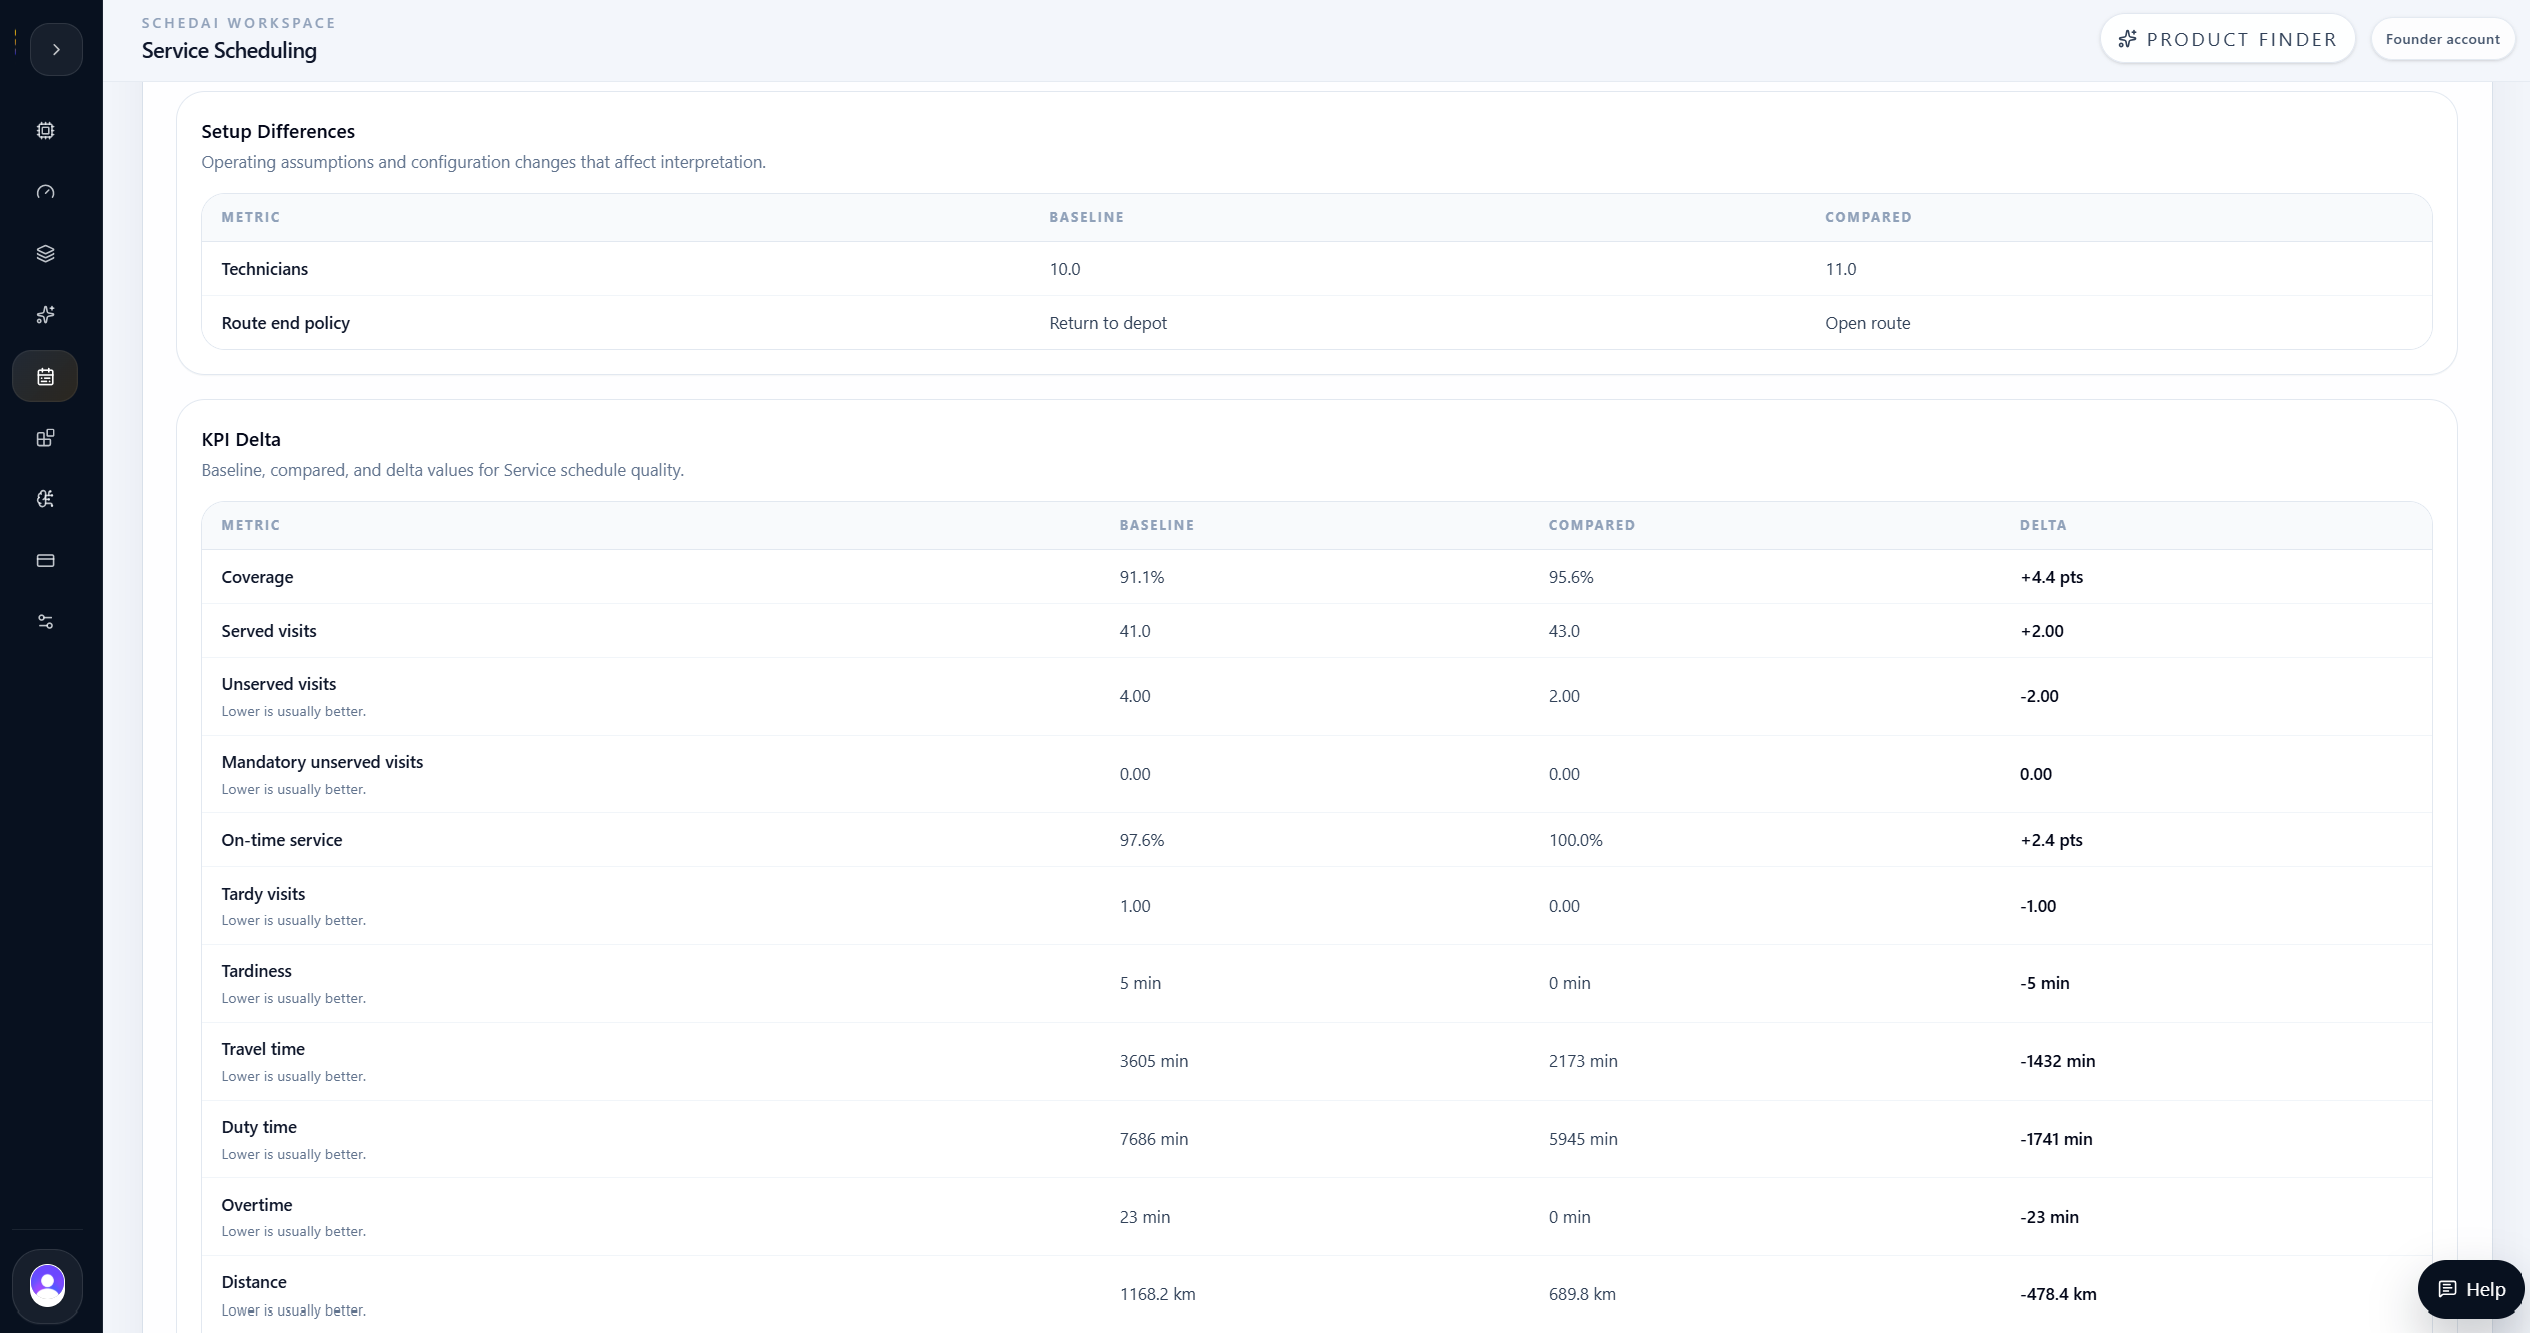
| Metric | Baseline | Combined branch | Result |
|---|---|---|---|
| Coverage | 91.1% | 95.6% | Improved |
| Served visits | 41 | 43 | +2 visits |
| Unserved visits | 4 | 2 | -2 visits |
| Tardy visits | 1 | 0 | Removed |
| Tardiness | 5 min | 0 min | Removed |
| Overtime | 23 min | 0 min | Removed |
| Travel time | about 3,708 min | about 2,173 min | Reduced |
| Distance | about 1,201.9 km | about 689.8 km | Reduced |
| Fairness gap | 525 min | 436 min | Improved |
Operational Decision
The team selected the combined recovery branch for review.
The team selected the combined recovery branch as the stronger dispatch plan to review.
The decision was evidence-based. The branch improved service coverage, cut unserved visits in half, removed tardiness, removed overtime, reduced travel and distance, and improved workload balance.
The team still had two unserved visits to investigate, so the branch was not treated as a magic fix. It was treated as a better operational plan with a narrower remaining gap.
For the service team, that is the practical value of SchedAI Service Scheduling: it can expose a pressured baseline, explain the bottleneck, test a realistic recovery branch, and compare the result before dispatch decisions become commitments.
Final takeaway
The baseline was feasible, but it still left visible service gaps. The combined branch showed a better path: add the right Wednesday skill capacity and remove return-to-depot travel from the branch.
SchedAI did not only produce a route plan. It helped the team understand the baseline, test a realistic recovery option, and choose a stronger dispatch plan with evidence.
Model a medium-size HVAC field-service schedule with technicians, skills, depots, visits, time windows, priorities, and travel.
Generate a feasible baseline that keeps unserved visits, tardiness, and overtime visible.
Use AI Explain to identify the Wednesday refrigeration-and-controls bottleneck.
Use What-if Analysis to test a combined staffing and route-policy recovery branch.
Use AI Compare to verify KPI movement, assignment changes, and route burden reduction.
Choose the stronger branch while preserving visibility into the remaining unserved work.