

Executive Summary
Fraud Detection turned model comparison into a governed card-risk scoring workflow.
A payments operations team needed a practical fraud-risk workflow for card-not-present transactions. The goal was not to produce a single black-box model. The team needed to train candidate models, compare evidence, stage a defensible saved version, and score a fresh batch of unlabeled transactions for review.
The case used 1,600 labeled records from an anonymized credit-card fraud sample. Each row included Time, Amount, and anonymized PCA-style features V1 through V28. PCA means principal component analysis: a transformation that hides raw transaction attributes while preserving patterns useful for modeling.
The team trained Logistic Regression, LightGBM, and XGBoost as saved model versions. Logistic Regression acted as the transparent baseline. LightGBM and XGBoost tested whether boosted tree models could reduce review noise while preserving enough fraud capture.
AI Compare showed the trade-off clearly. Logistic Regression had the strongest recall and ranking metrics, but XGBoost sharply reduced false positives and delivered the strongest balanced operating profile. The team staged XGBoost, scored 400 unlabeled rows, and used AI Summary and AI Explain to interpret threshold, alert-rate, calibration, and review-workload implications.
Training
1,600 rows
Models tested
Logistic, LightGBM, XGBoost
Scoring
400 rows
Core capabilities exercised
- Project-backed Fraud workspace with saved model versions, staged model state, and scoring history.
- Labeled CSV training with target normalization to a binary Class field.
- Multiple model families for risk scoring: Logistic Regression, LightGBM, Random Forest, and XGBoost.
- Saved model naming, staging, calibration metadata, dataset lineage, and content identity checks.
- AI Compare for saved-version review across metrics, threshold evidence, calibration, and burden summaries.
- Scoring through the staged model or a selected saved version without changing project state.
- AI Summary and AI Explain grounded in scored rows, saved-model evidence, and evaluation context.
Operating context
The fraud team needed a review workflow, not only a probability score.
Fraud scoring is not only a model-training problem. A payment team also needs an operating decision: which transactions should be reviewed first, how much review workload the threshold creates, and what risk is introduced by false positives and false negatives.
A false positive is a legitimate transaction flagged as suspicious. It creates customer friction and unnecessary review work. A false negative is a fraudulent transaction missed by the model. It creates loss exposure. A useful fraud workflow has to discuss both.
This case uses anonymized card-transaction data. Because the V1 through V28 columns are transformed features rather than named fields like merchant category or device age, the report does not invent business meanings for them. It treats them honestly as model features and focuses the use case on lifecycle governance, evidence, and review decisions.
Fraud challenge
The model decision had to balance fraud capture against review friction.
The team needed to avoid two common mistakes. First, they did not want to stage the first model just because it trained successfully. Second, they did not want to select the most complex model just because it looked more advanced.
The product therefore had to support a complete review loop: upload labeled data, train candidate saved versions, compare metrics and burden summaries, stage the preferred model, score an unlabeled batch, and explain the result without pretending the threshold was already a production policy.
That makes the Fraud use case different from a simple threshold slider demo. The important question is not only whether the model can flag suspicious rows. The important question is whether the team can see the trade-off before operationalizing it.
The workflow needed to prove
- Compare model families before staging a project default.
- Define recall, precision, F1, AUC-PR, AUC-ROC, and Brier score before relying on them.
- Keep dataset lineage and training-data content identity visible.
- Separate a cross-validated reference threshold from production policy.
- Show false-positive and false-negative burden, not only headline accuracy.
- Score unlabeled rows while preserving saved-model provenance.
Method: Data setup
The case used labeled training data and a separate unlabeled scoring batch.
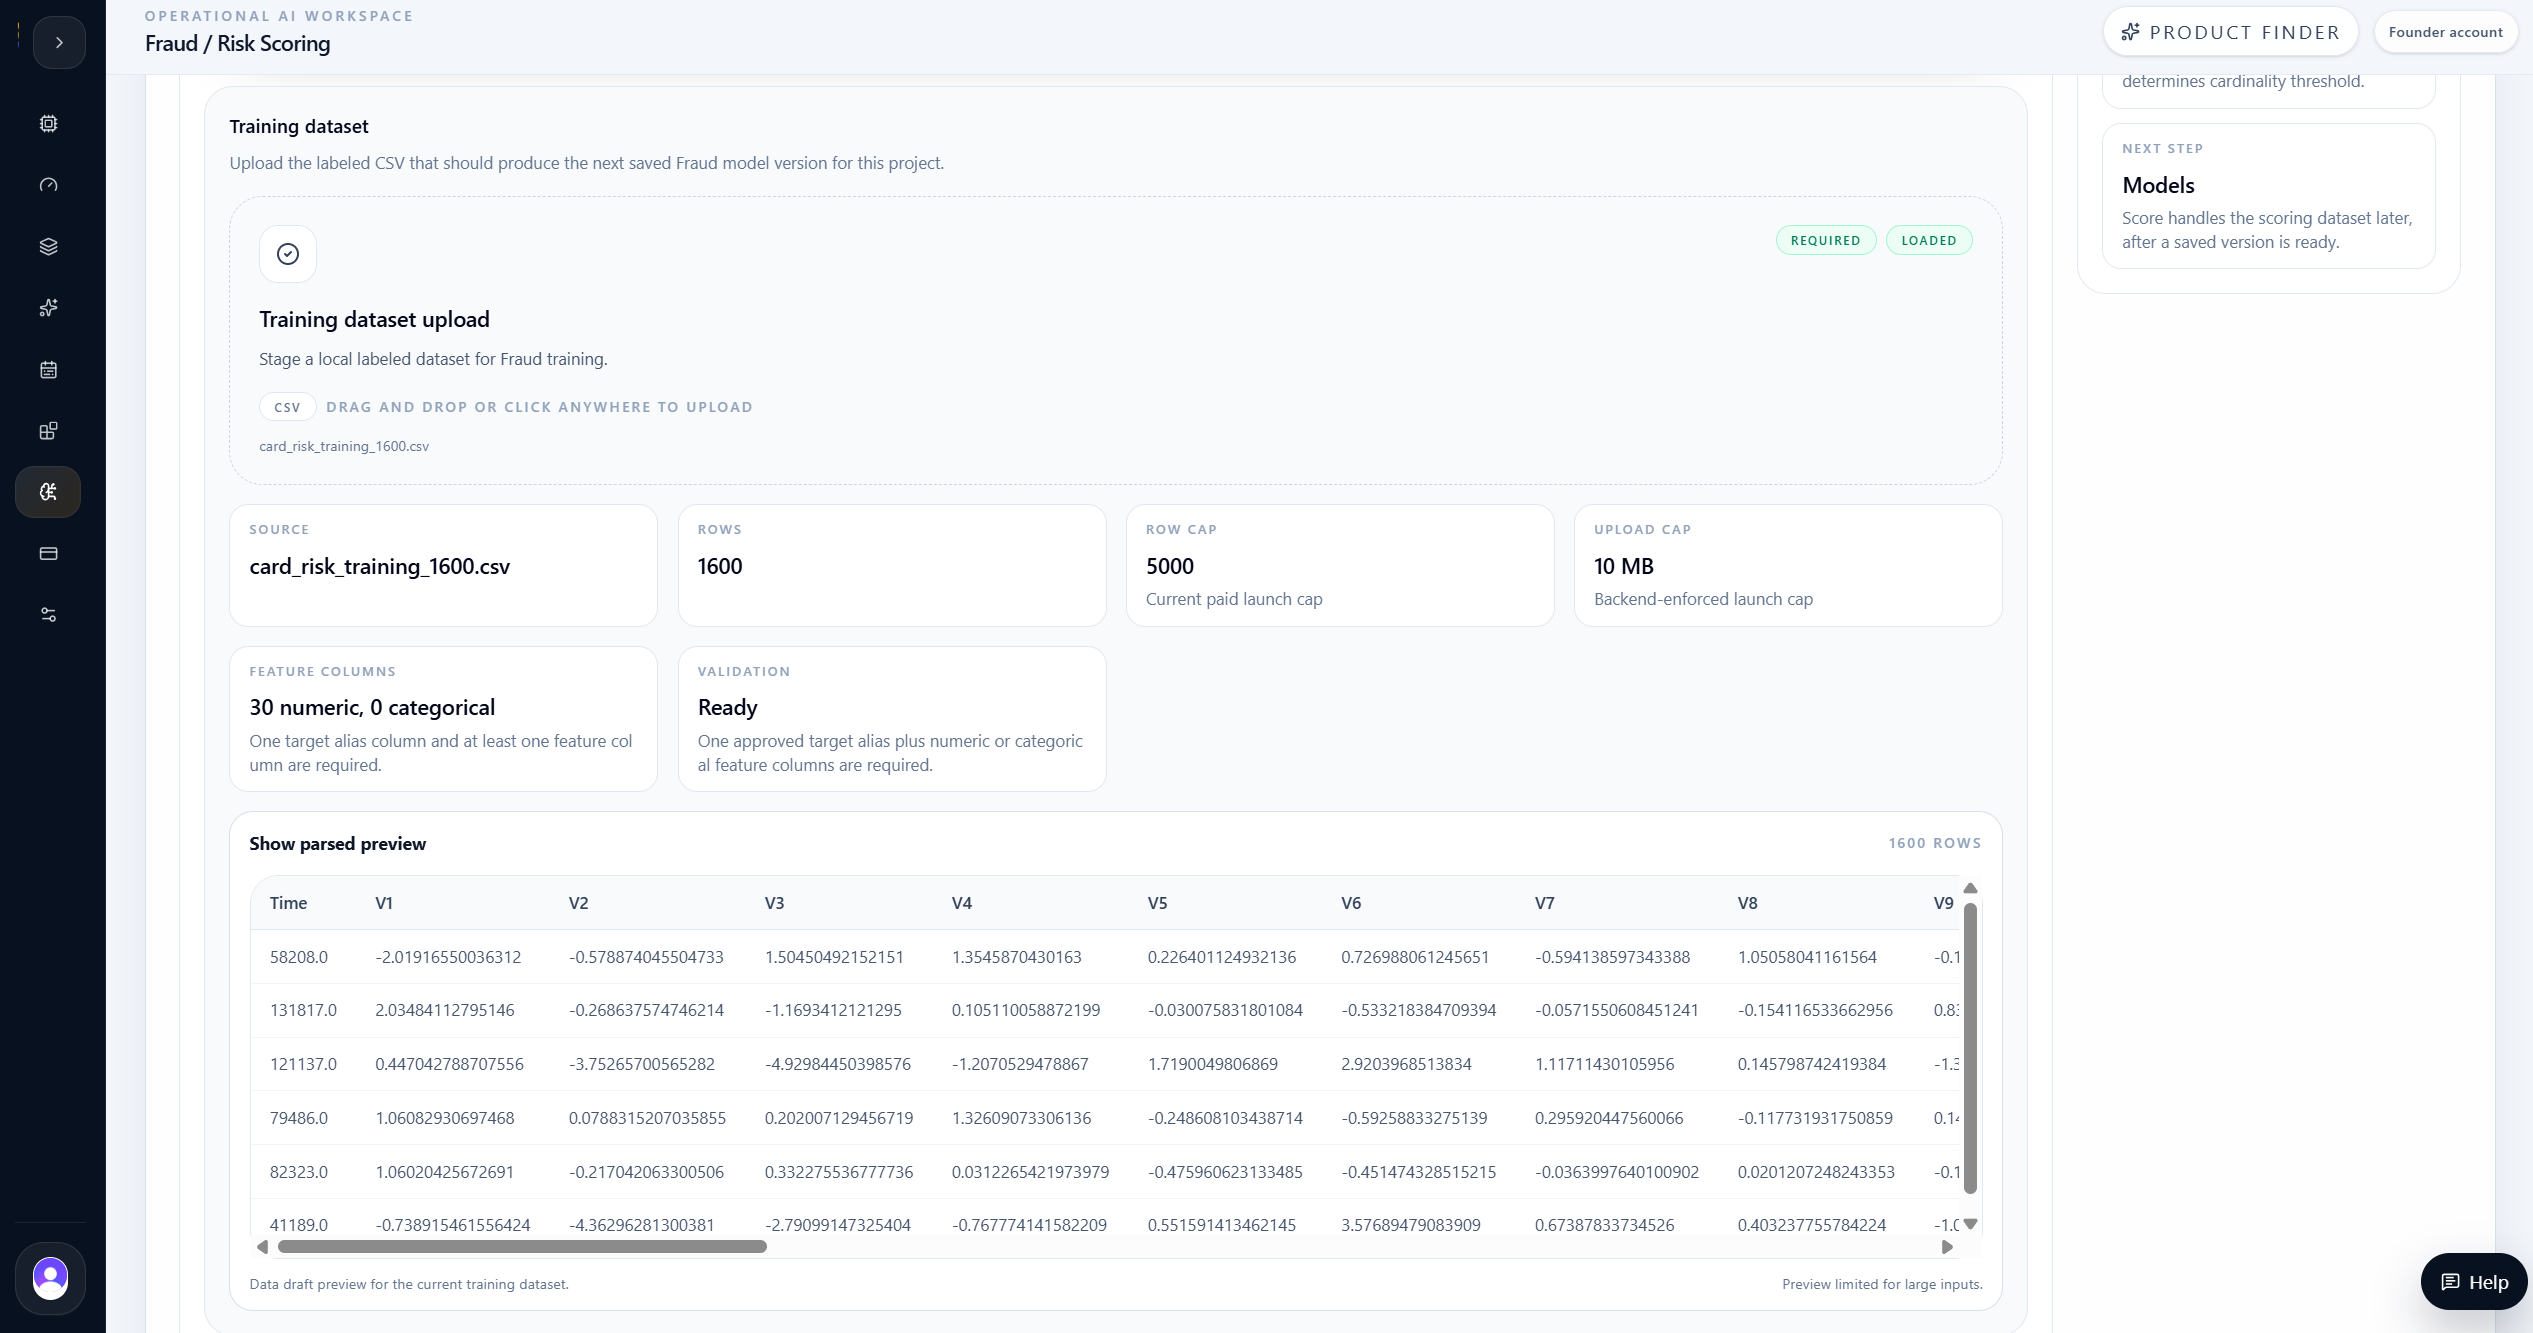
The team uploaded a labeled training file with 1,600 anonymized transactions. The target column was Class: 1 for fraud and 0 for non-fraud. The file contained 166 fraud records and 1,434 non-fraud records, giving the models enough positive cases to learn from while still reflecting the imbalance typical of fraud work.
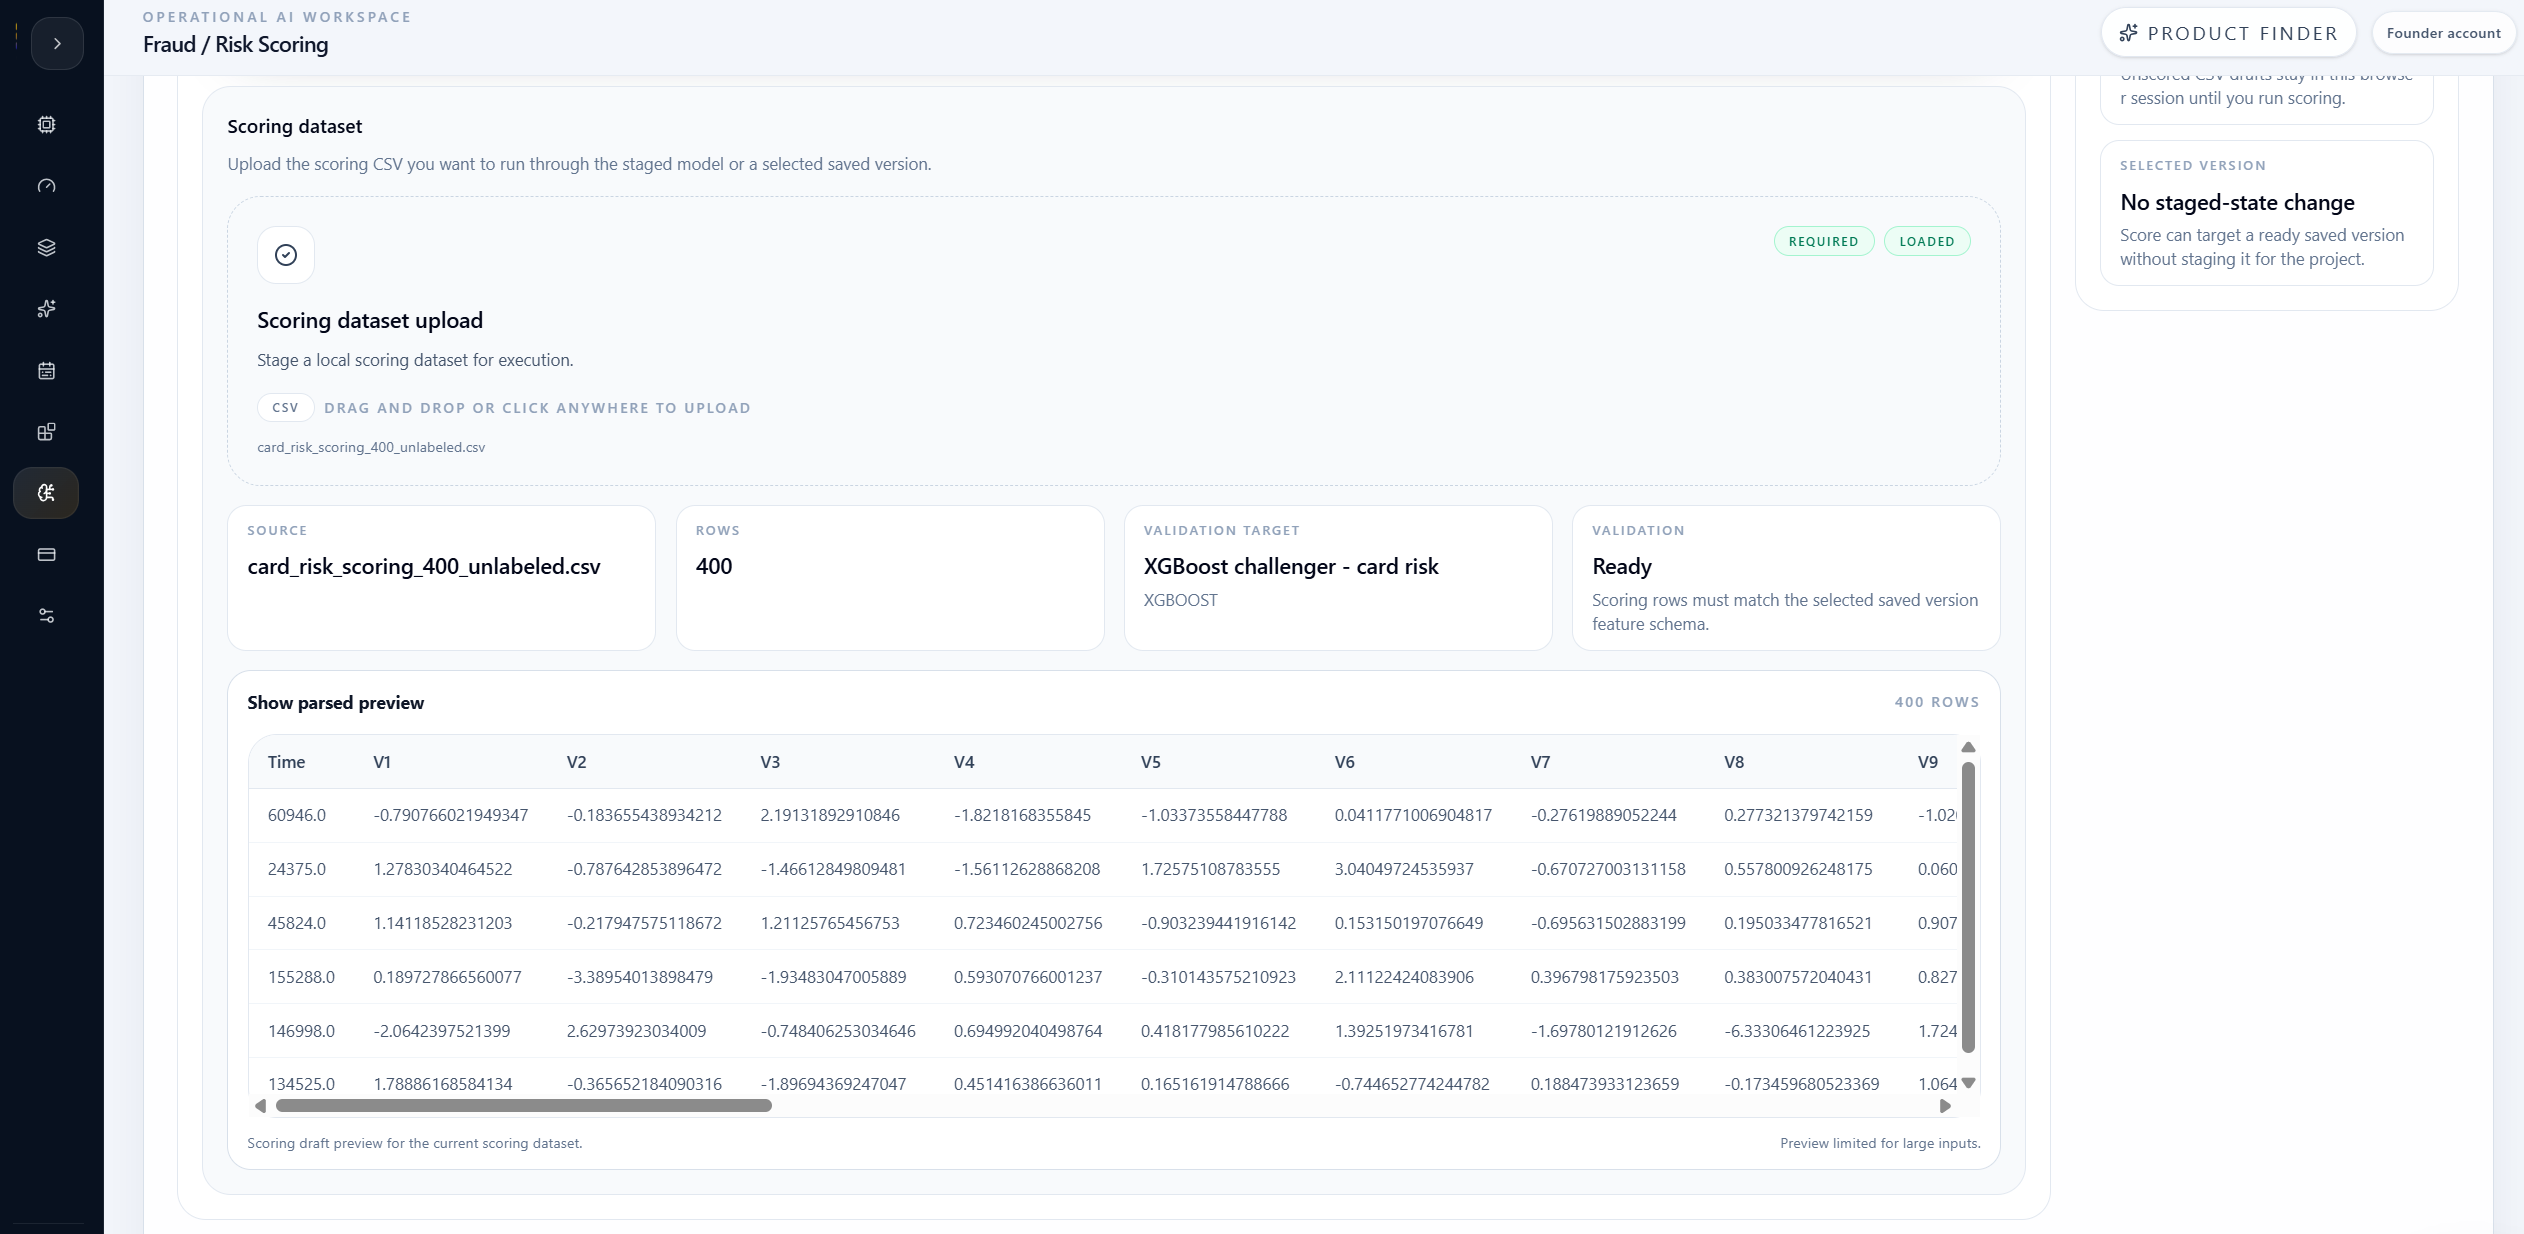
The scoring file was separate and unlabeled. It included the same feature schema without Class, allowing the staged model to score 400 transactions as an operational review batch.
The workspace retained recent training datasets with display name, version, row count, related model count, and content fingerprint. That mattered because model comparison is only trustworthy when users can see whether candidates used the same training content.
Dataset scope
- Training rows: 1,600.
- Fraud positives: 166.
- Non-fraud rows: 1,434.
- Scoring rows: 400 unlabeled transactions.
- Features: Time, Amount, and anonymized V1-V28 PCA-style signals.
- Target: Class, normalized as the binary fraud label.

Method: Train models
Three saved fraud models were trained from the same transaction content.
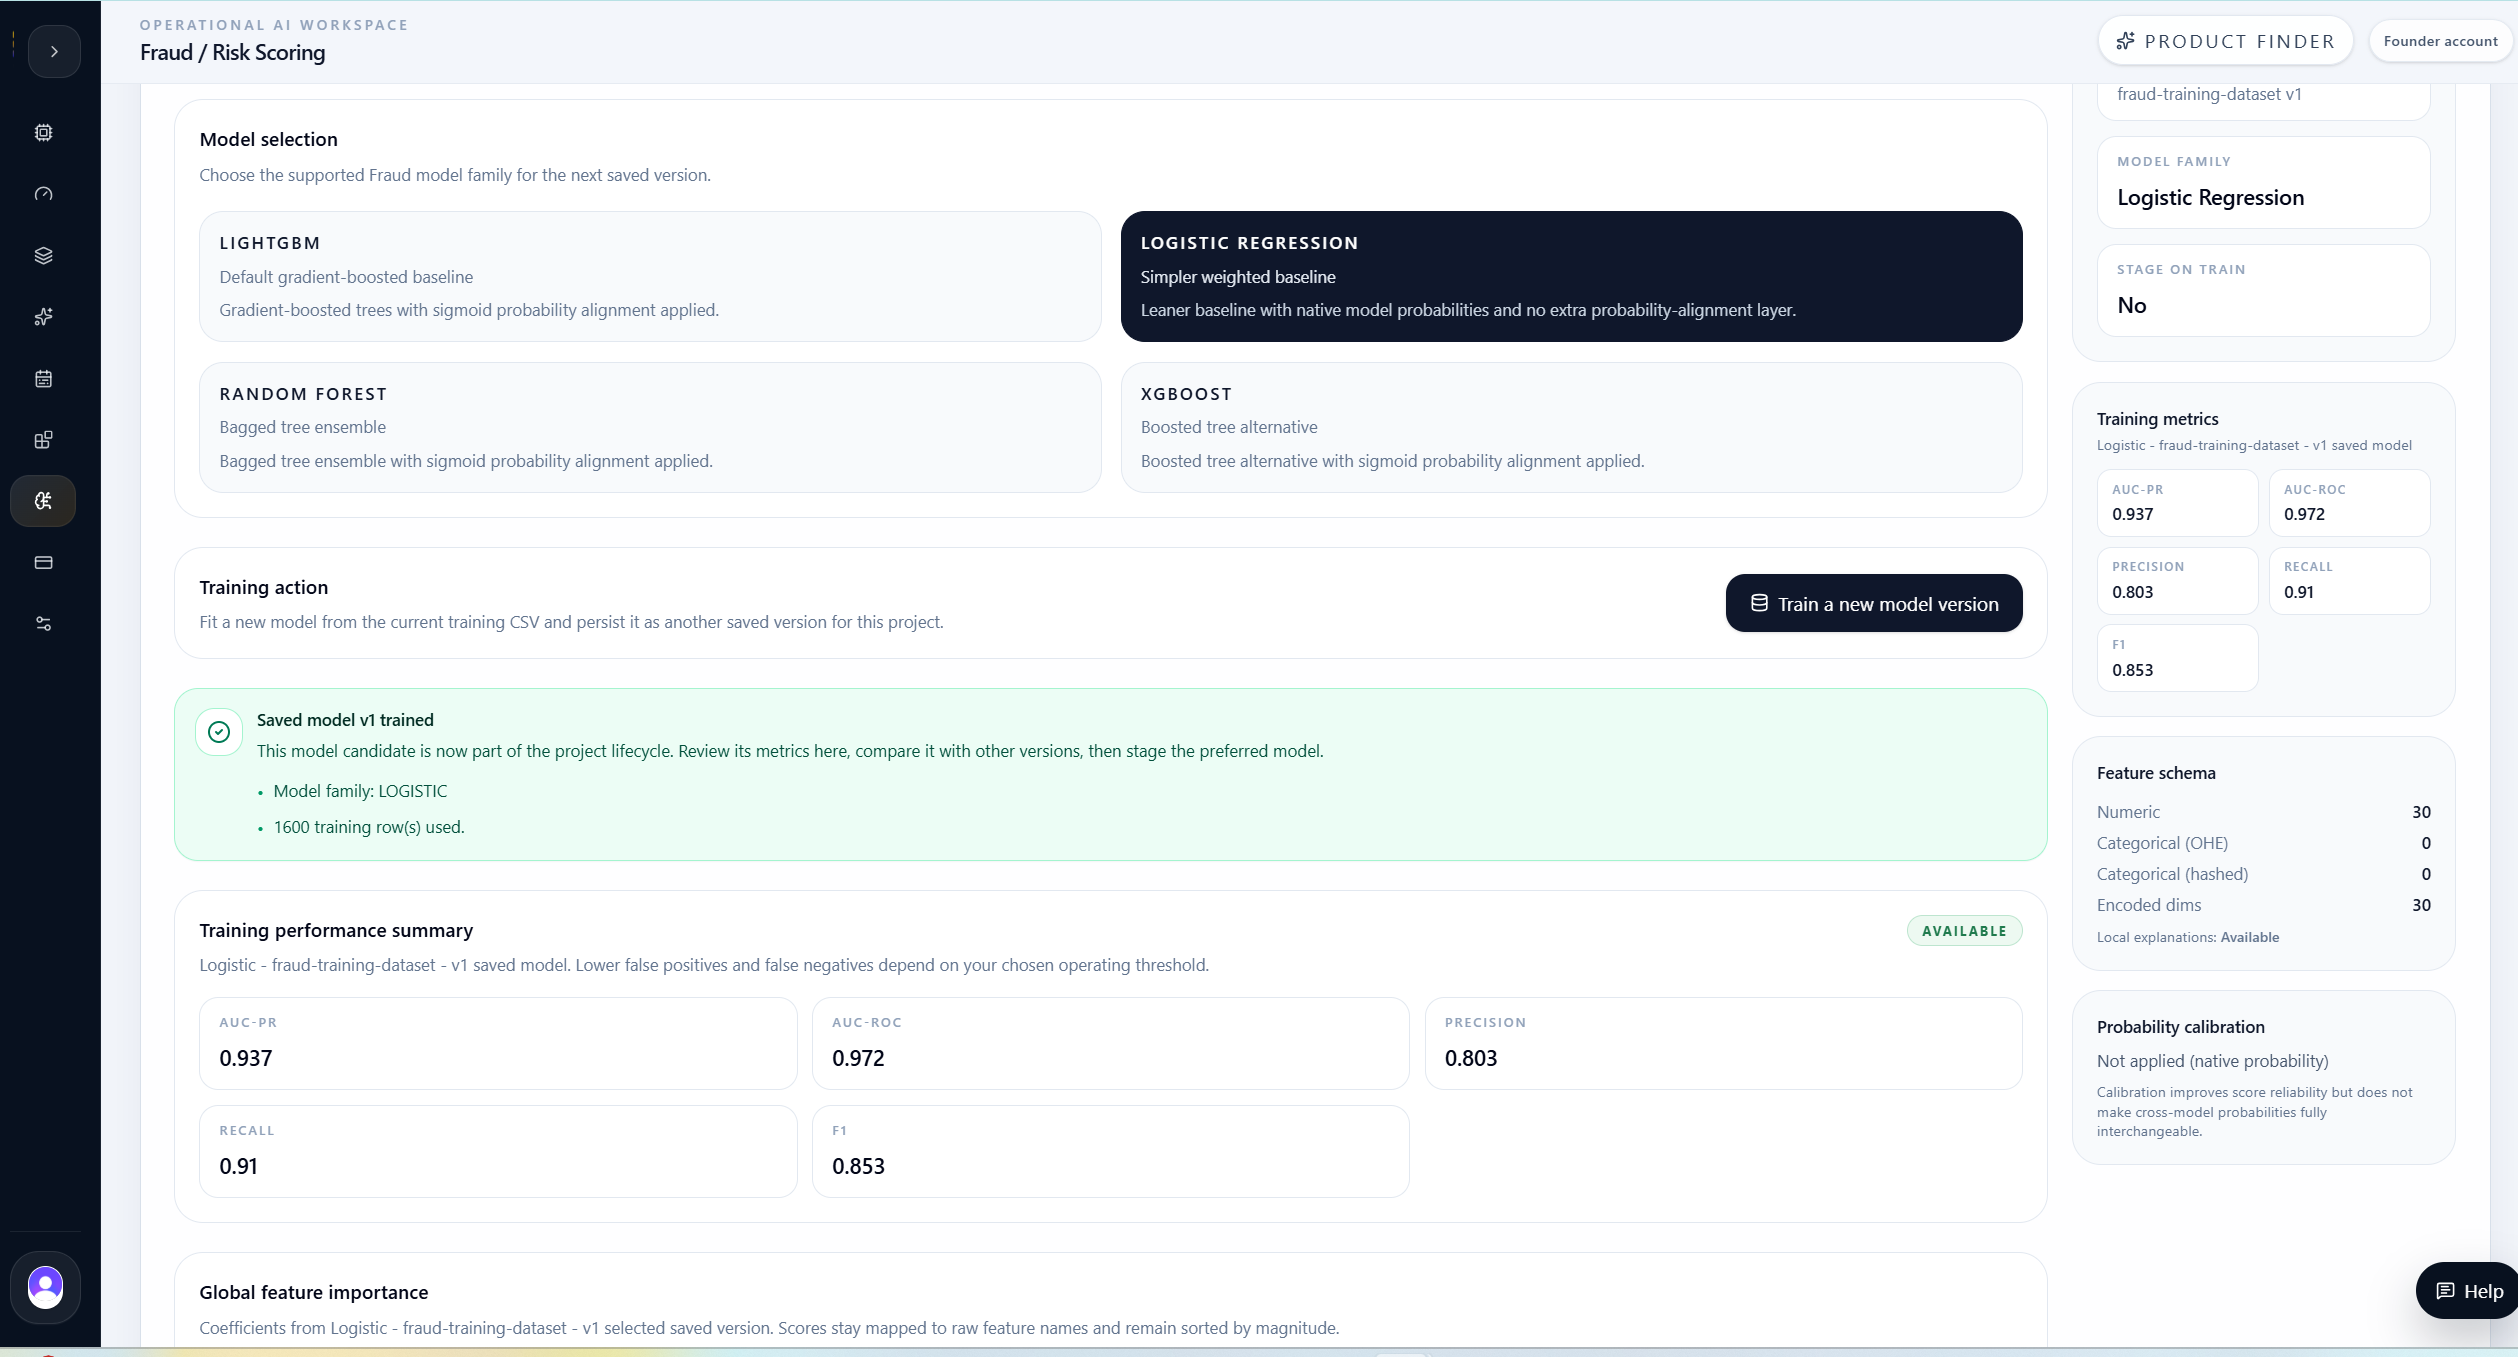
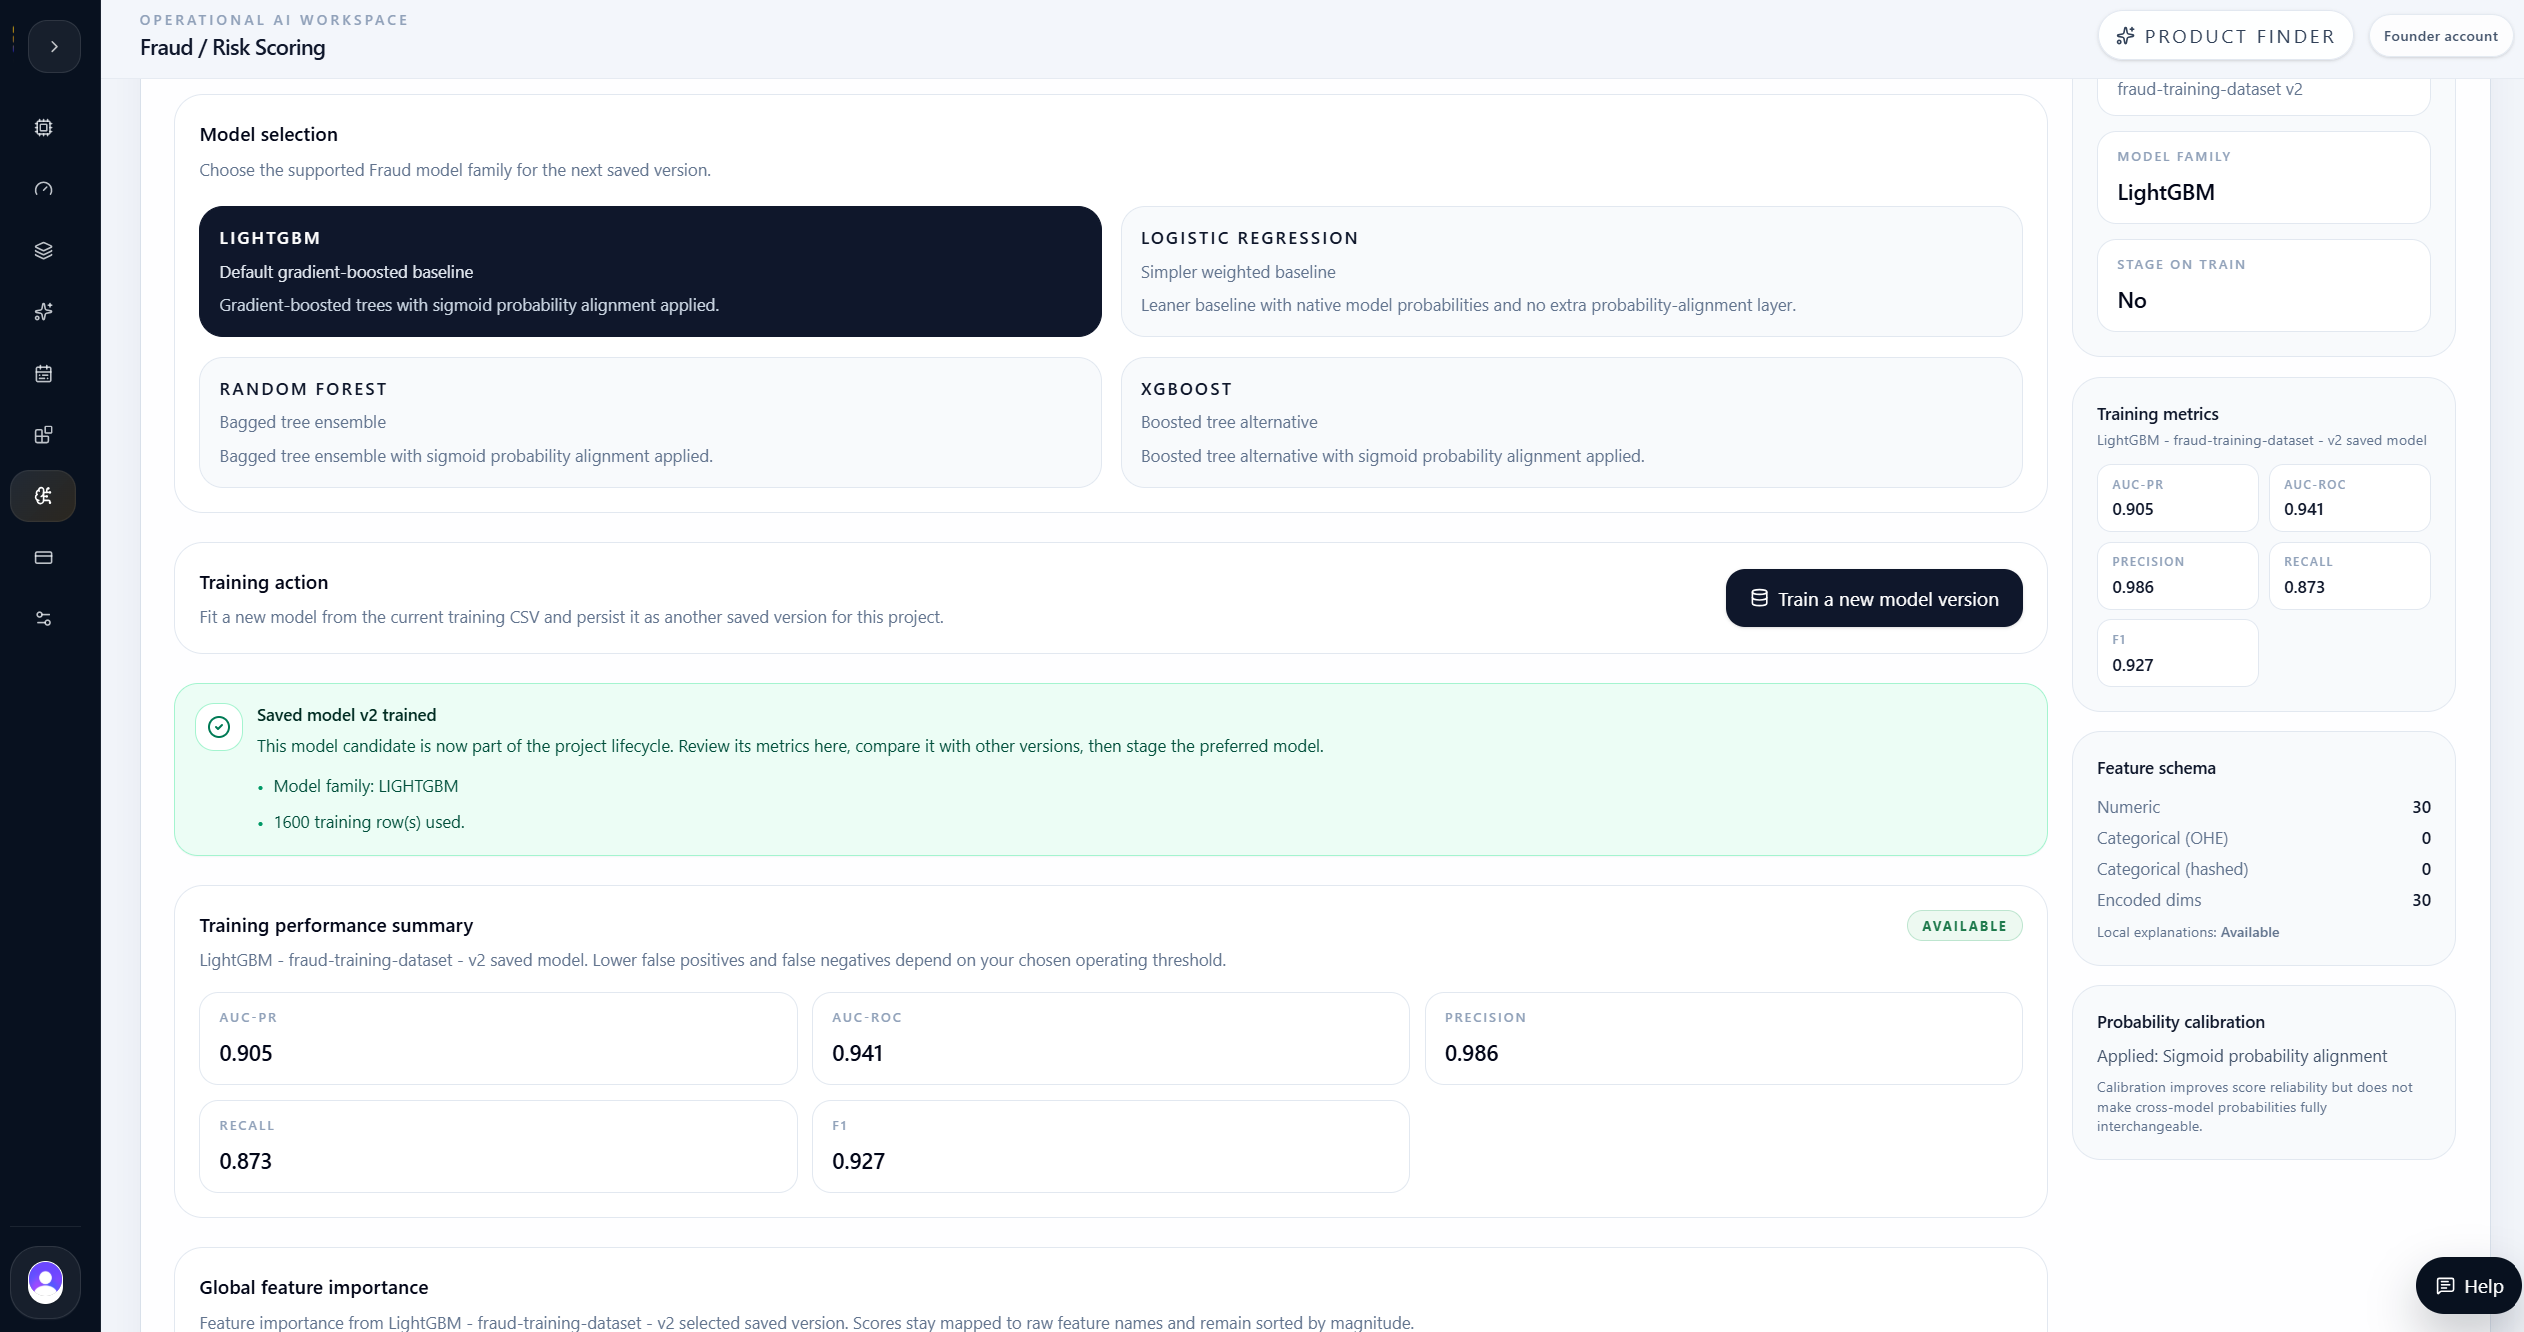
The team trained three saved model versions from the same training content. Logistic Regression became the baseline because it is lean, fast, and easier to explain. LightGBM and XGBoost tested boosted-tree alternatives that can capture nonlinear patterns.
Each saved model carried more than a model family label. The workspace retained metrics, calibration notes, feature schema, evaluation threshold, confusion counts, burden summaries, and lineage evidence. The user also renamed versions so the comparison could be read by business operators instead of only by version number.
This is the right machine-learning workflow for a product demo. It shows that MAG OptiAI can support model review and governance rather than only returning a probability column.
Training evidence captured
- Logistic baseline - card risk: transparent baseline.
- LightGBM challenger - card risk: gradient-boosted tree candidate.
- XGBoost challenger - card risk: boosted tree candidate selected for staging.
- All three versions used the same stored training-data content fingerprint.
- All three used 30 numeric features and no categorical encoded features.
- Tree models used sigmoid probability alignment for score calibration.

Model comparison
AI Compare made the model trade-off explicit before staging.
Terms used in this comparison
Precision
Of the transactions flagged as fraud, the share that were truly fraud in evaluation. Higher precision means fewer false alarms.
Recall
Of the known fraud cases, the share caught by the model. Higher recall means fewer missed fraud cases.
F1 score
A balance between precision and recall. It is useful when the team wants one compact measure of review quality.
AUC-PR
Area under the precision-recall curve. It is often useful for imbalanced fraud data because positive cases are rare.
AUC-ROC
Area under the receiver operating characteristic curve. It measures ranking separation between fraud and non-fraud records.
Brier score
A probability calibration measure. Lower is better; it checks whether predicted probabilities are reliable.
Threshold
The score cutoff used to label a row for review. In this case 0.5 is a cross-validated reference threshold, not final production policy.
Alert rate
The share of evaluated rows that would be flagged at the selected threshold. It is a direct review-workload signal.
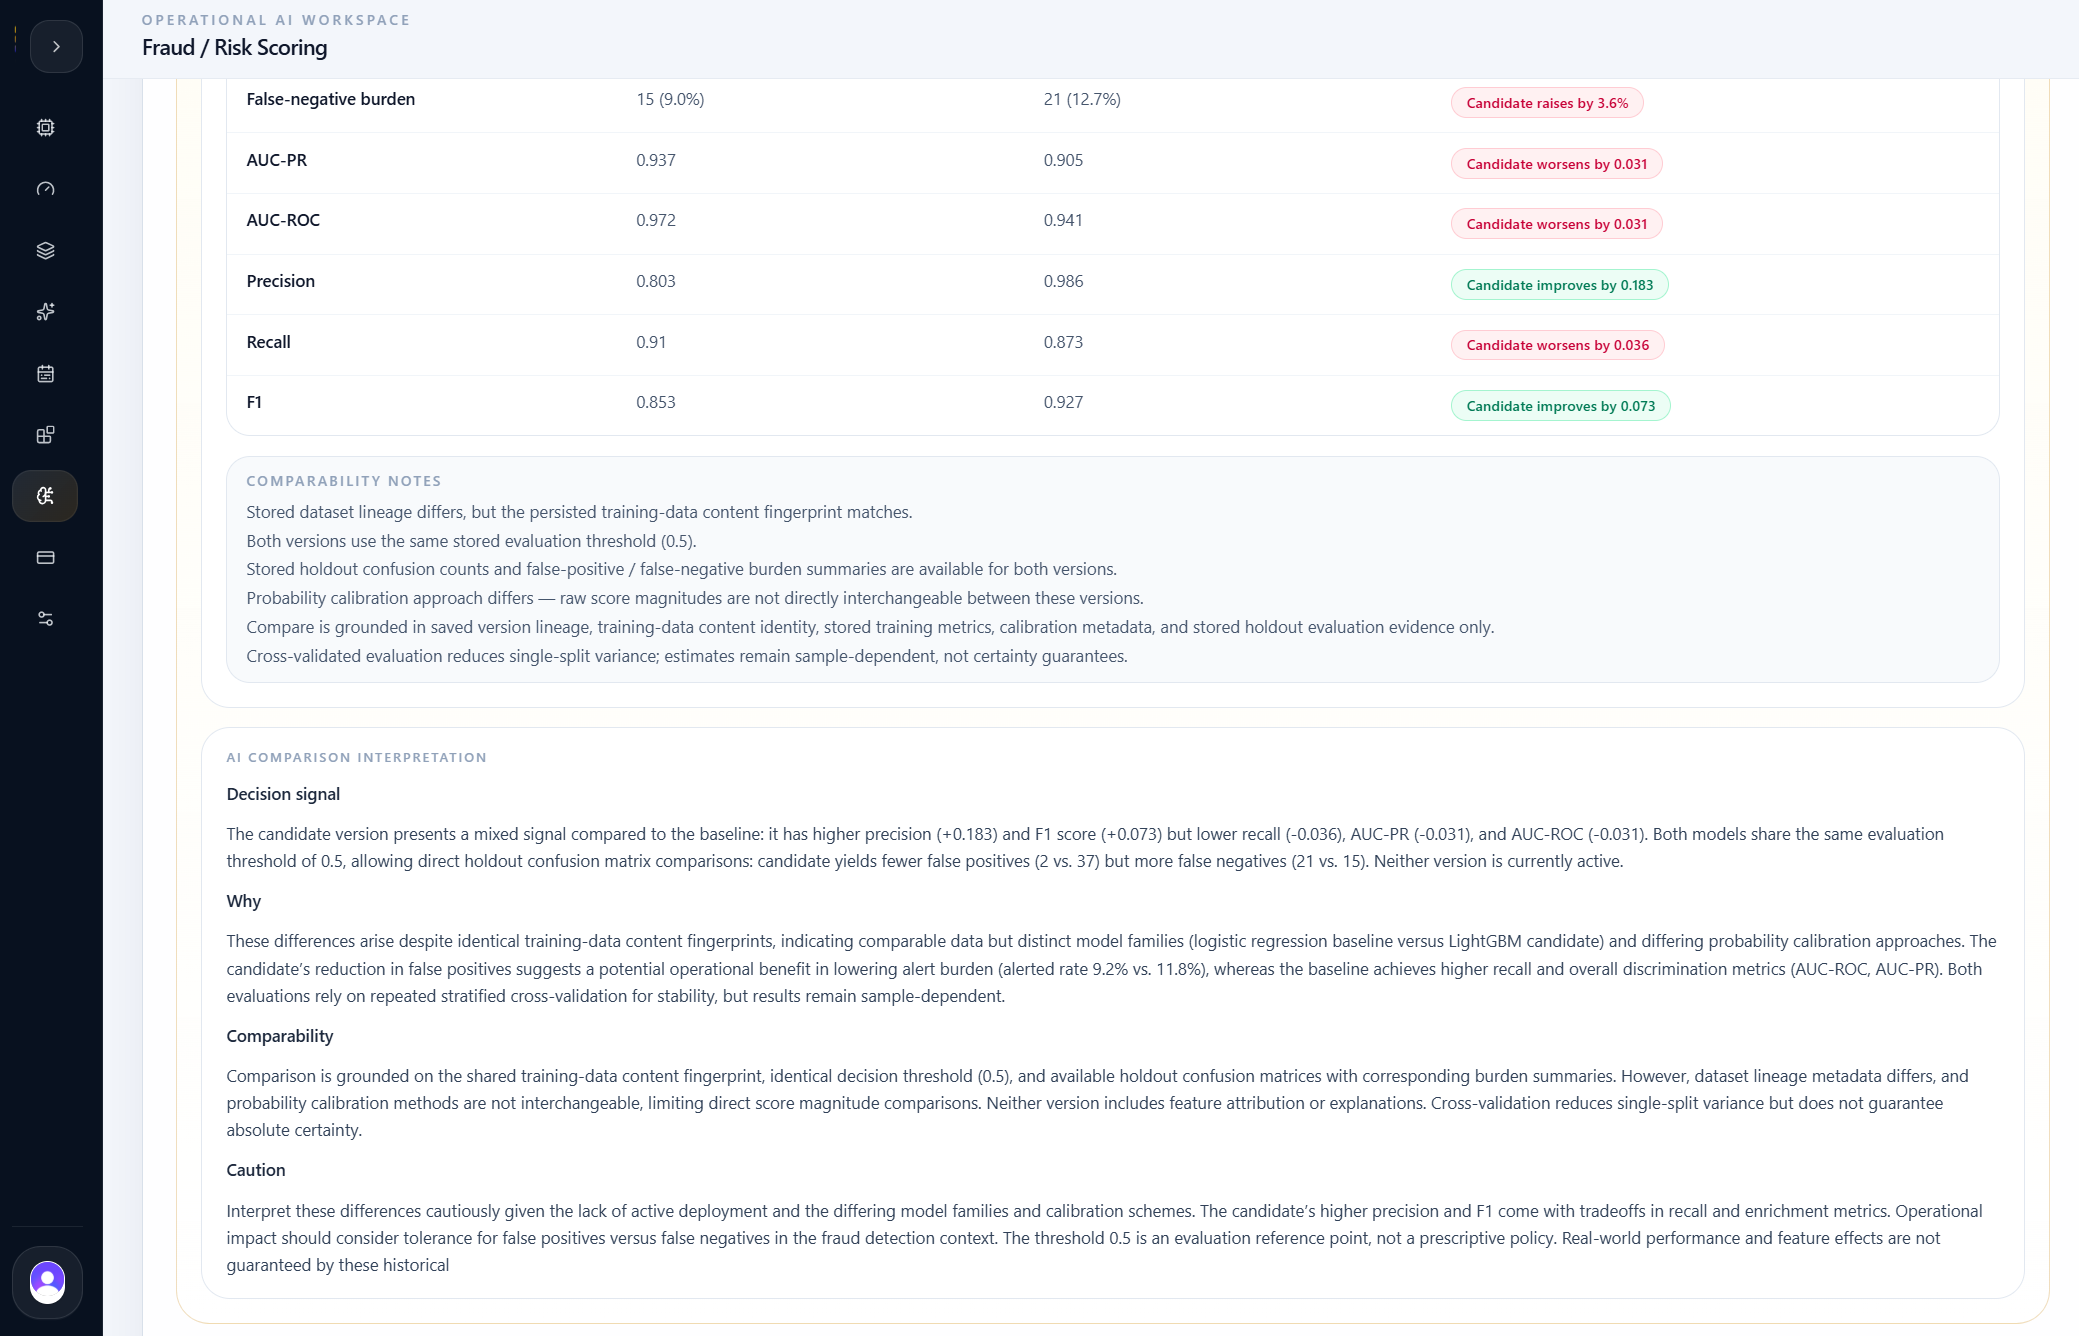
AI Compare made the model-selection decision concrete. Logistic Regression had strong recall at 0.910 and the highest AUC-PR and AUC-ROC, but it created more false positives. At the 0.5 reference threshold, it produced 37 false positives.
LightGBM improved precision to 0.986 and F1 to 0.927, but recall dropped to 0.873 and false negatives rose to 21. That meant fewer unnecessary reviews, but more missed fraud cases than the baseline.
XGBoost gave the better challenger profile. It matched LightGBM's F1 at 0.927, improved AUC-PR to 0.917, improved AUC-ROC to 0.958, improved recall to 0.880, and reduced false positives from 37 to 3 while adding fewer false negatives than LightGBM.
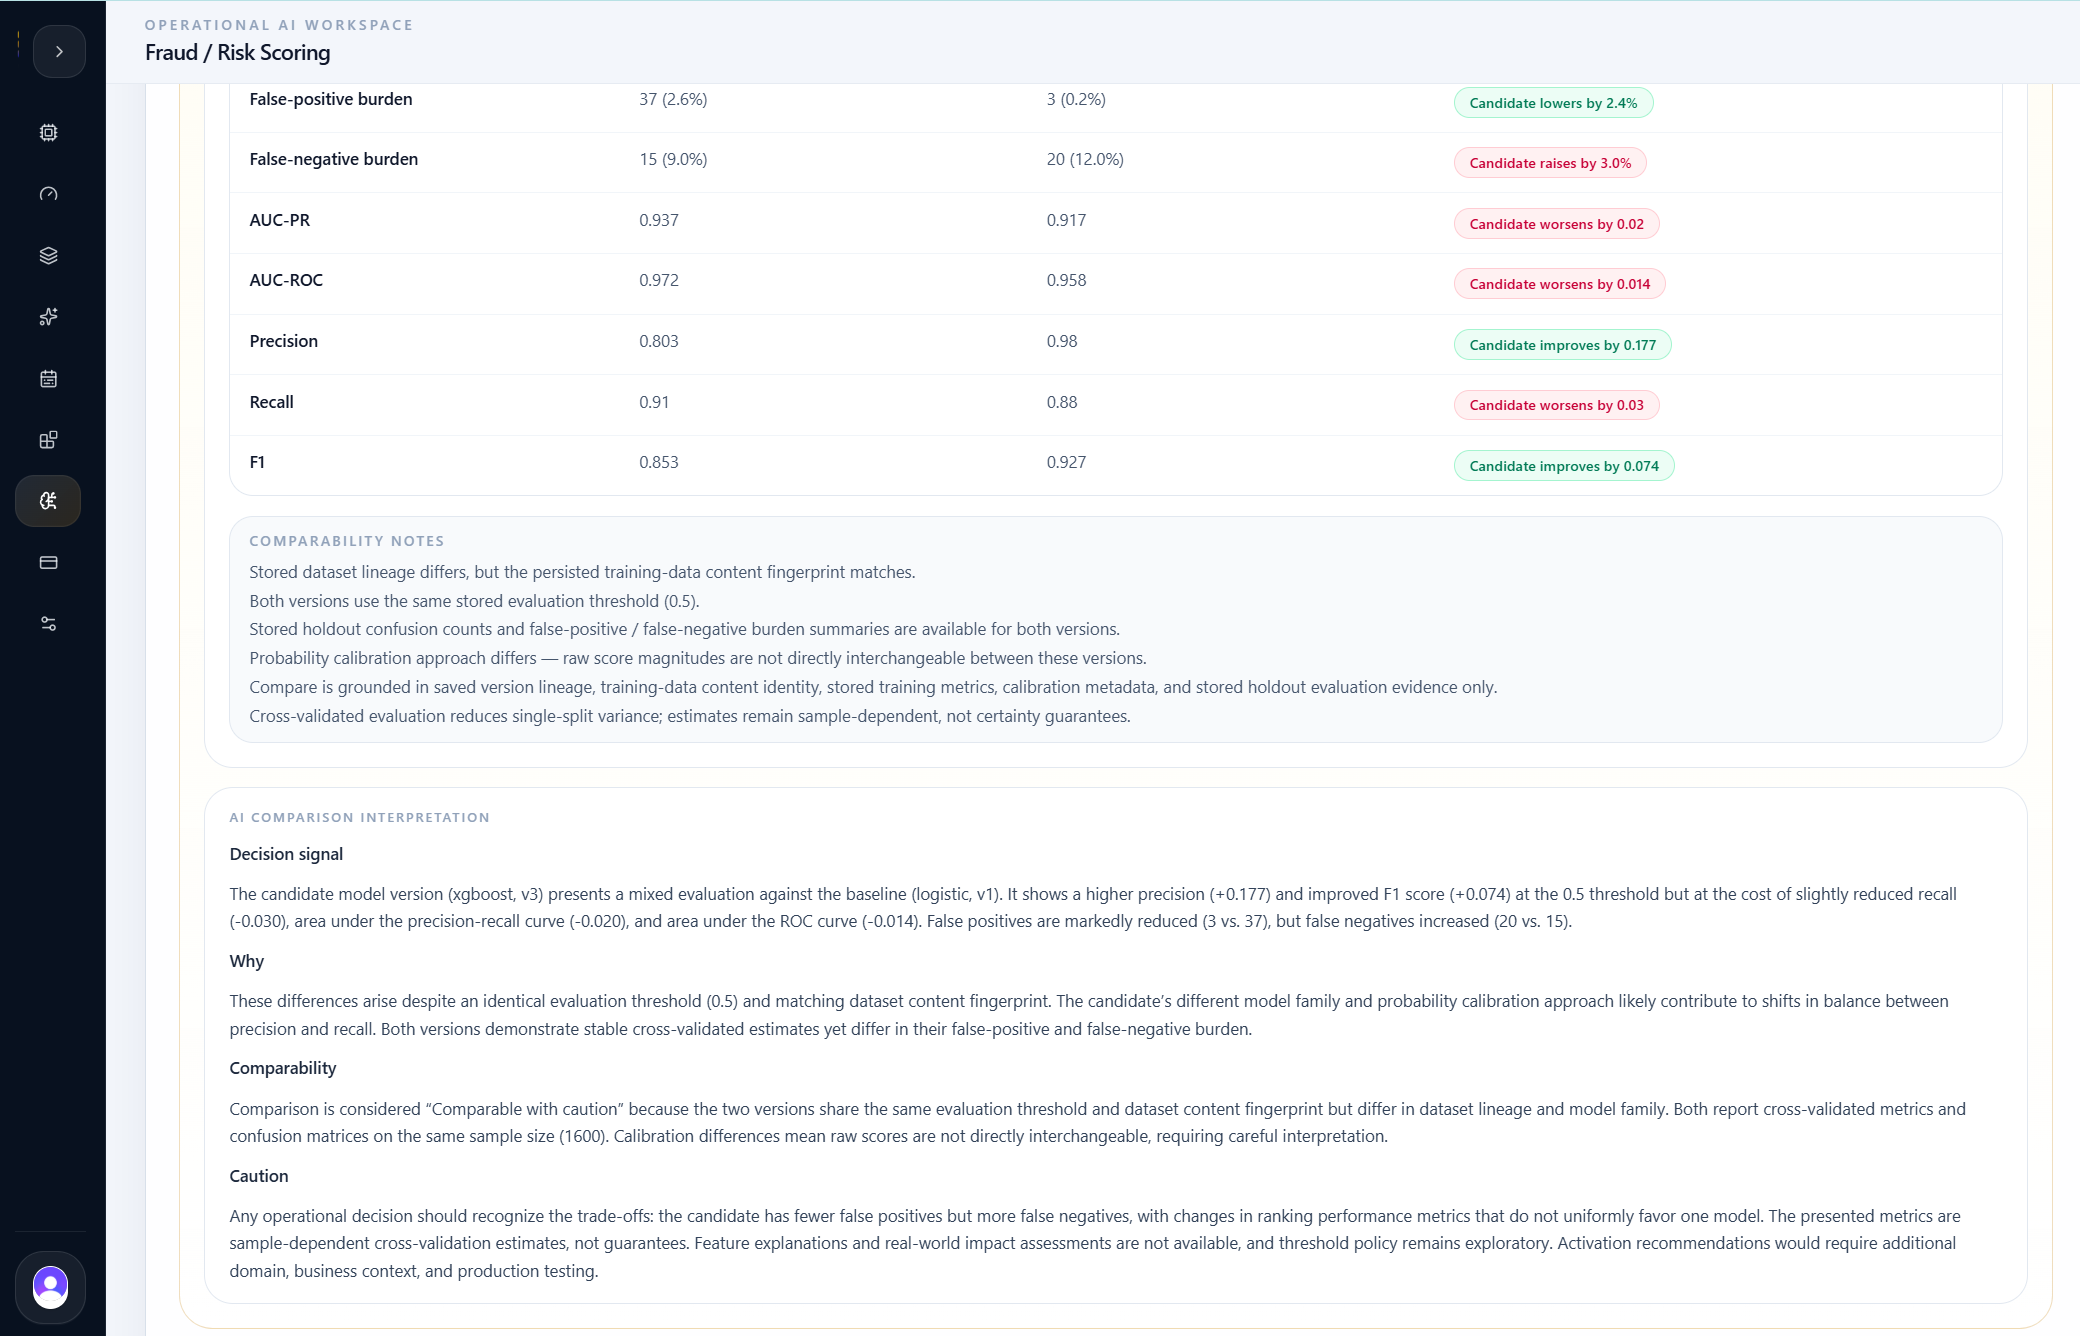
Baseline
Logistic Regression
0.910 recall
Stronger fraud capture but more false positives
Challenger
LightGBM
0.927 F1
High precision, but more missed fraud cases
Staged
XGBoost
3 false positives
Best balanced profile for this case
| Evidence | Result |
|---|---|
| Logistic AUC-PR | 0.937 |
| Logistic recall | 0.910 |
| Logistic false positives | 37 |
| LightGBM F1 | 0.927 |
| LightGBM false negatives | 21 |
| XGBoost F1 | 0.927 |
| XGBoost false positives | 3 |
| XGBoost false negatives | 20 |
| Decision signal | Stage XGBoost as the best balanced candidate for this case |
Staged model
The team staged XGBoost as the project scoring model.
After comparison, the team staged XGBoost challenger - card risk as the project execution model. Staging matters because it controls which saved model the project uses by default for scoring.
This was not an automatic crown. The team selected XGBoost because it offered the best balance for this review scenario: materially fewer false positives than Logistic Regression, better ranking metrics than LightGBM, and slightly lower missed-fraud burden than LightGBM.
The staged-model screen kept the other saved versions visible, so the decision remained reviewable. The baseline did not disappear just because a challenger was staged.
Staging semantics
A staged fraud model is the project default for scoring. It is a user decision backed by evidence, not an automatic promotion.
In this case, XGBoost was staged because it reduced review noise while maintaining strong fraud detection performance.

Scoring result
The staged XGBoost model scored 400 unlabeled transactions.
With XGBoost staged, the team uploaded a separate 400-row scoring file. The file was unlabeled, which matches the operating pattern: the team does not know in advance which incoming transactions are fraudulent.
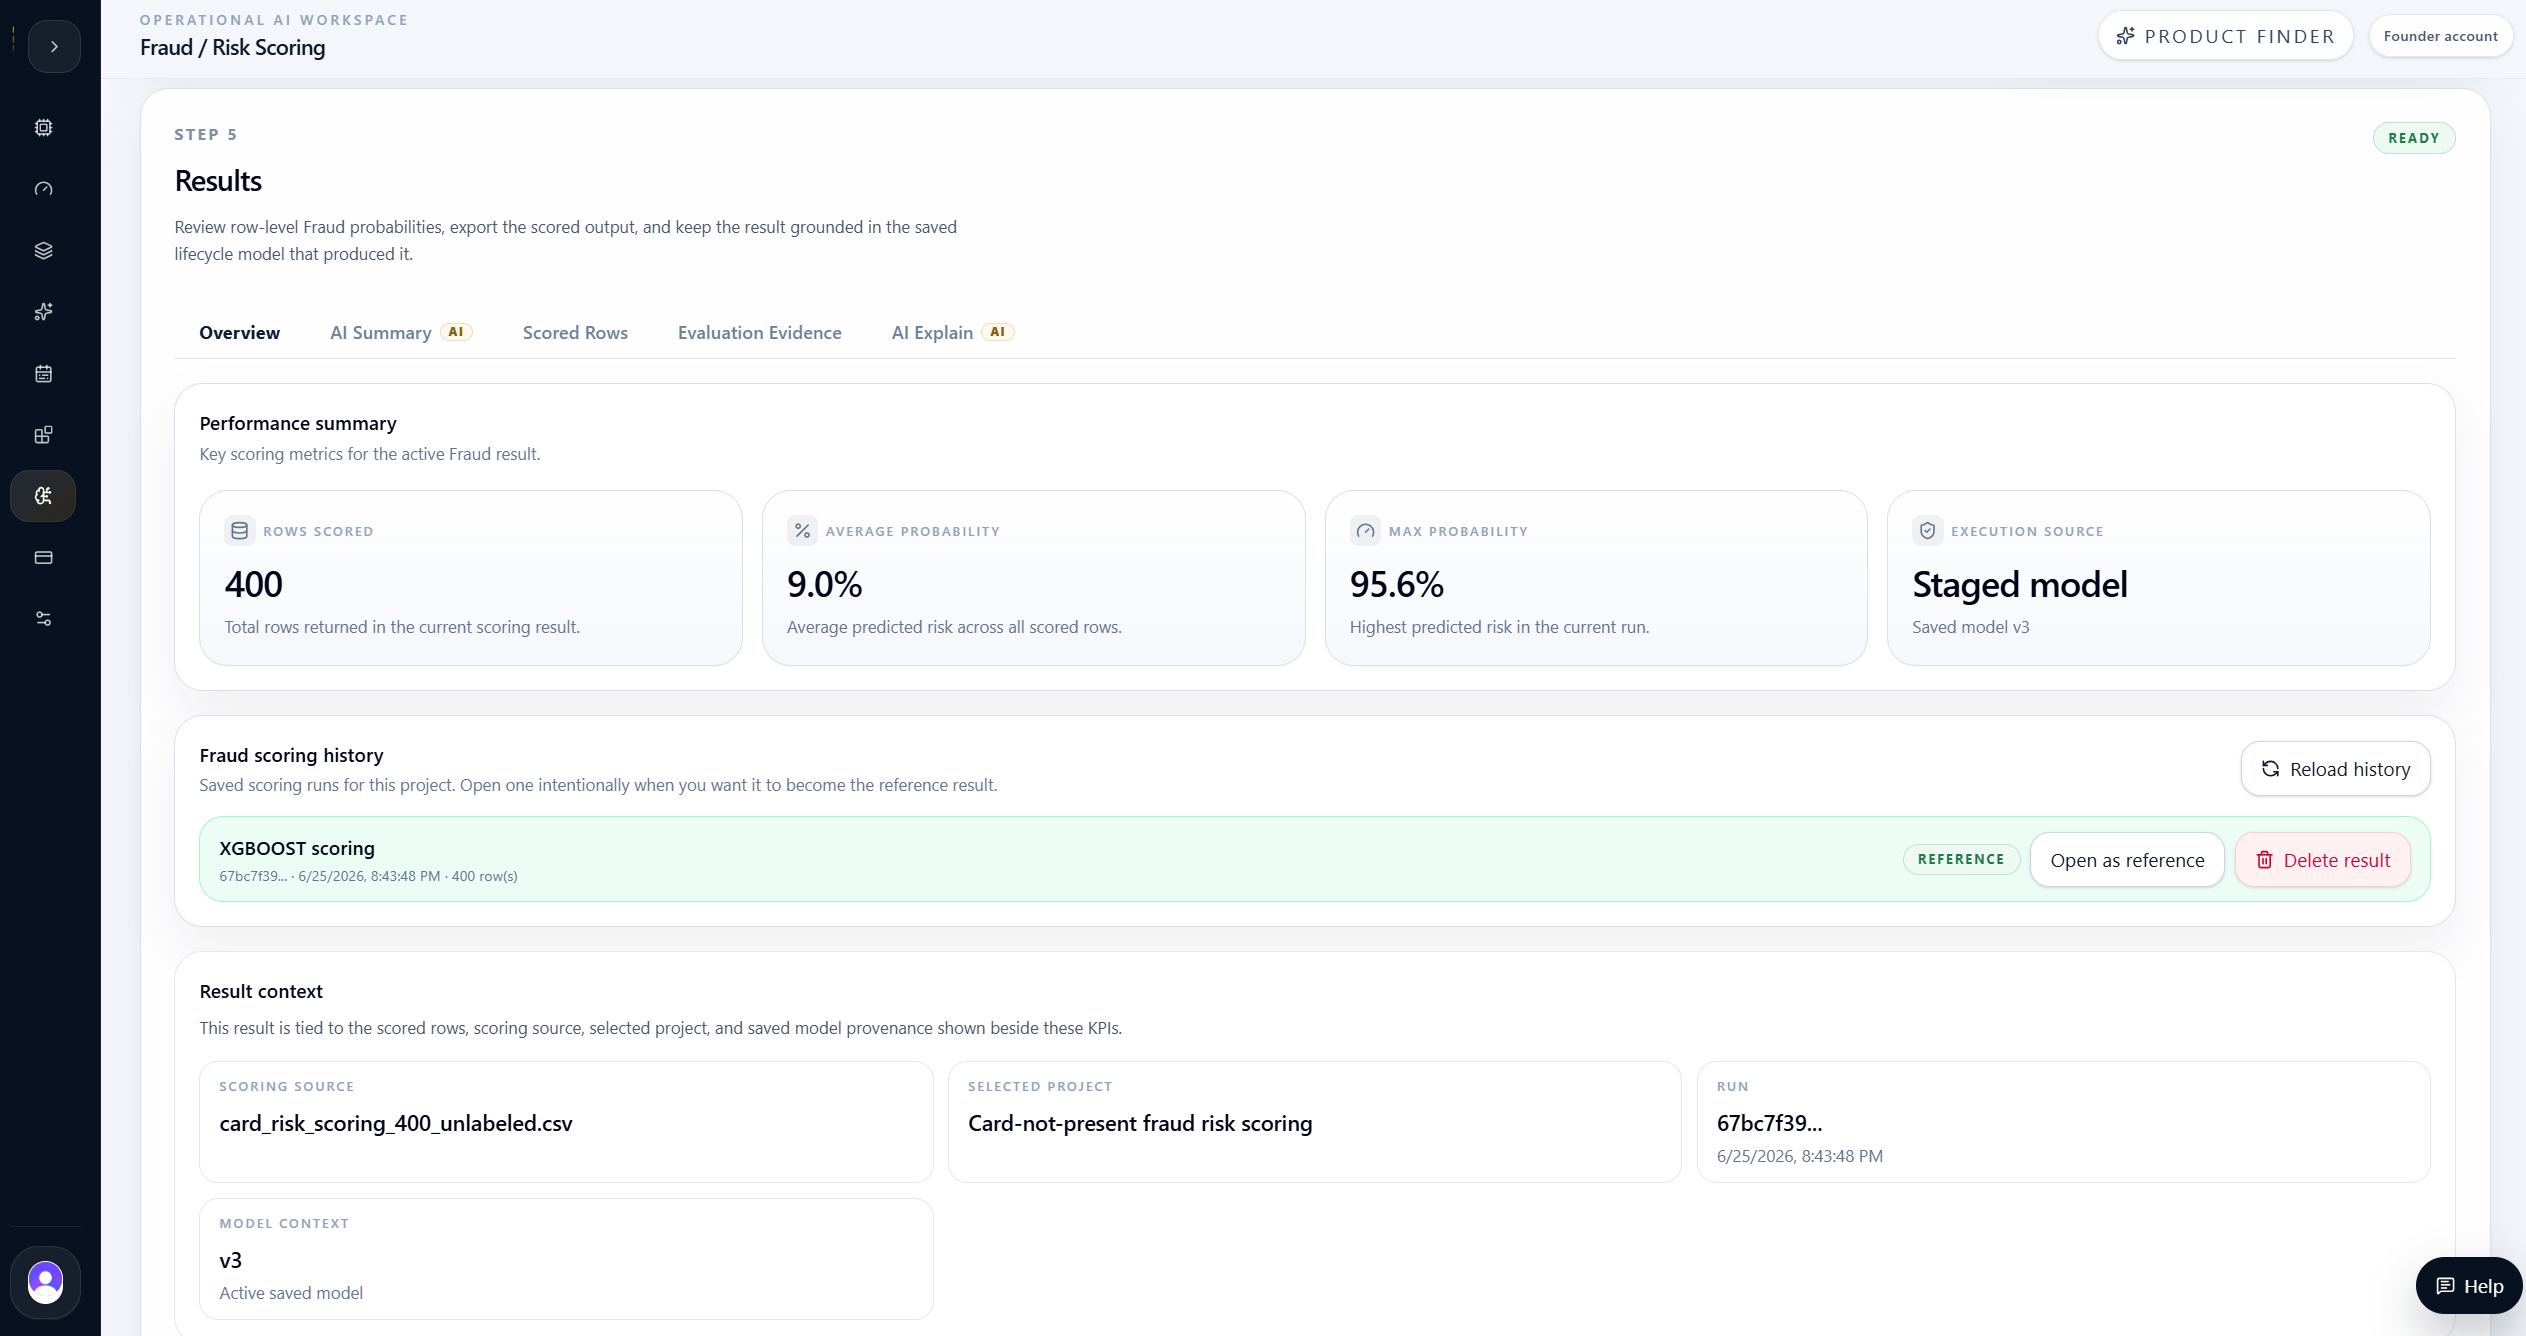
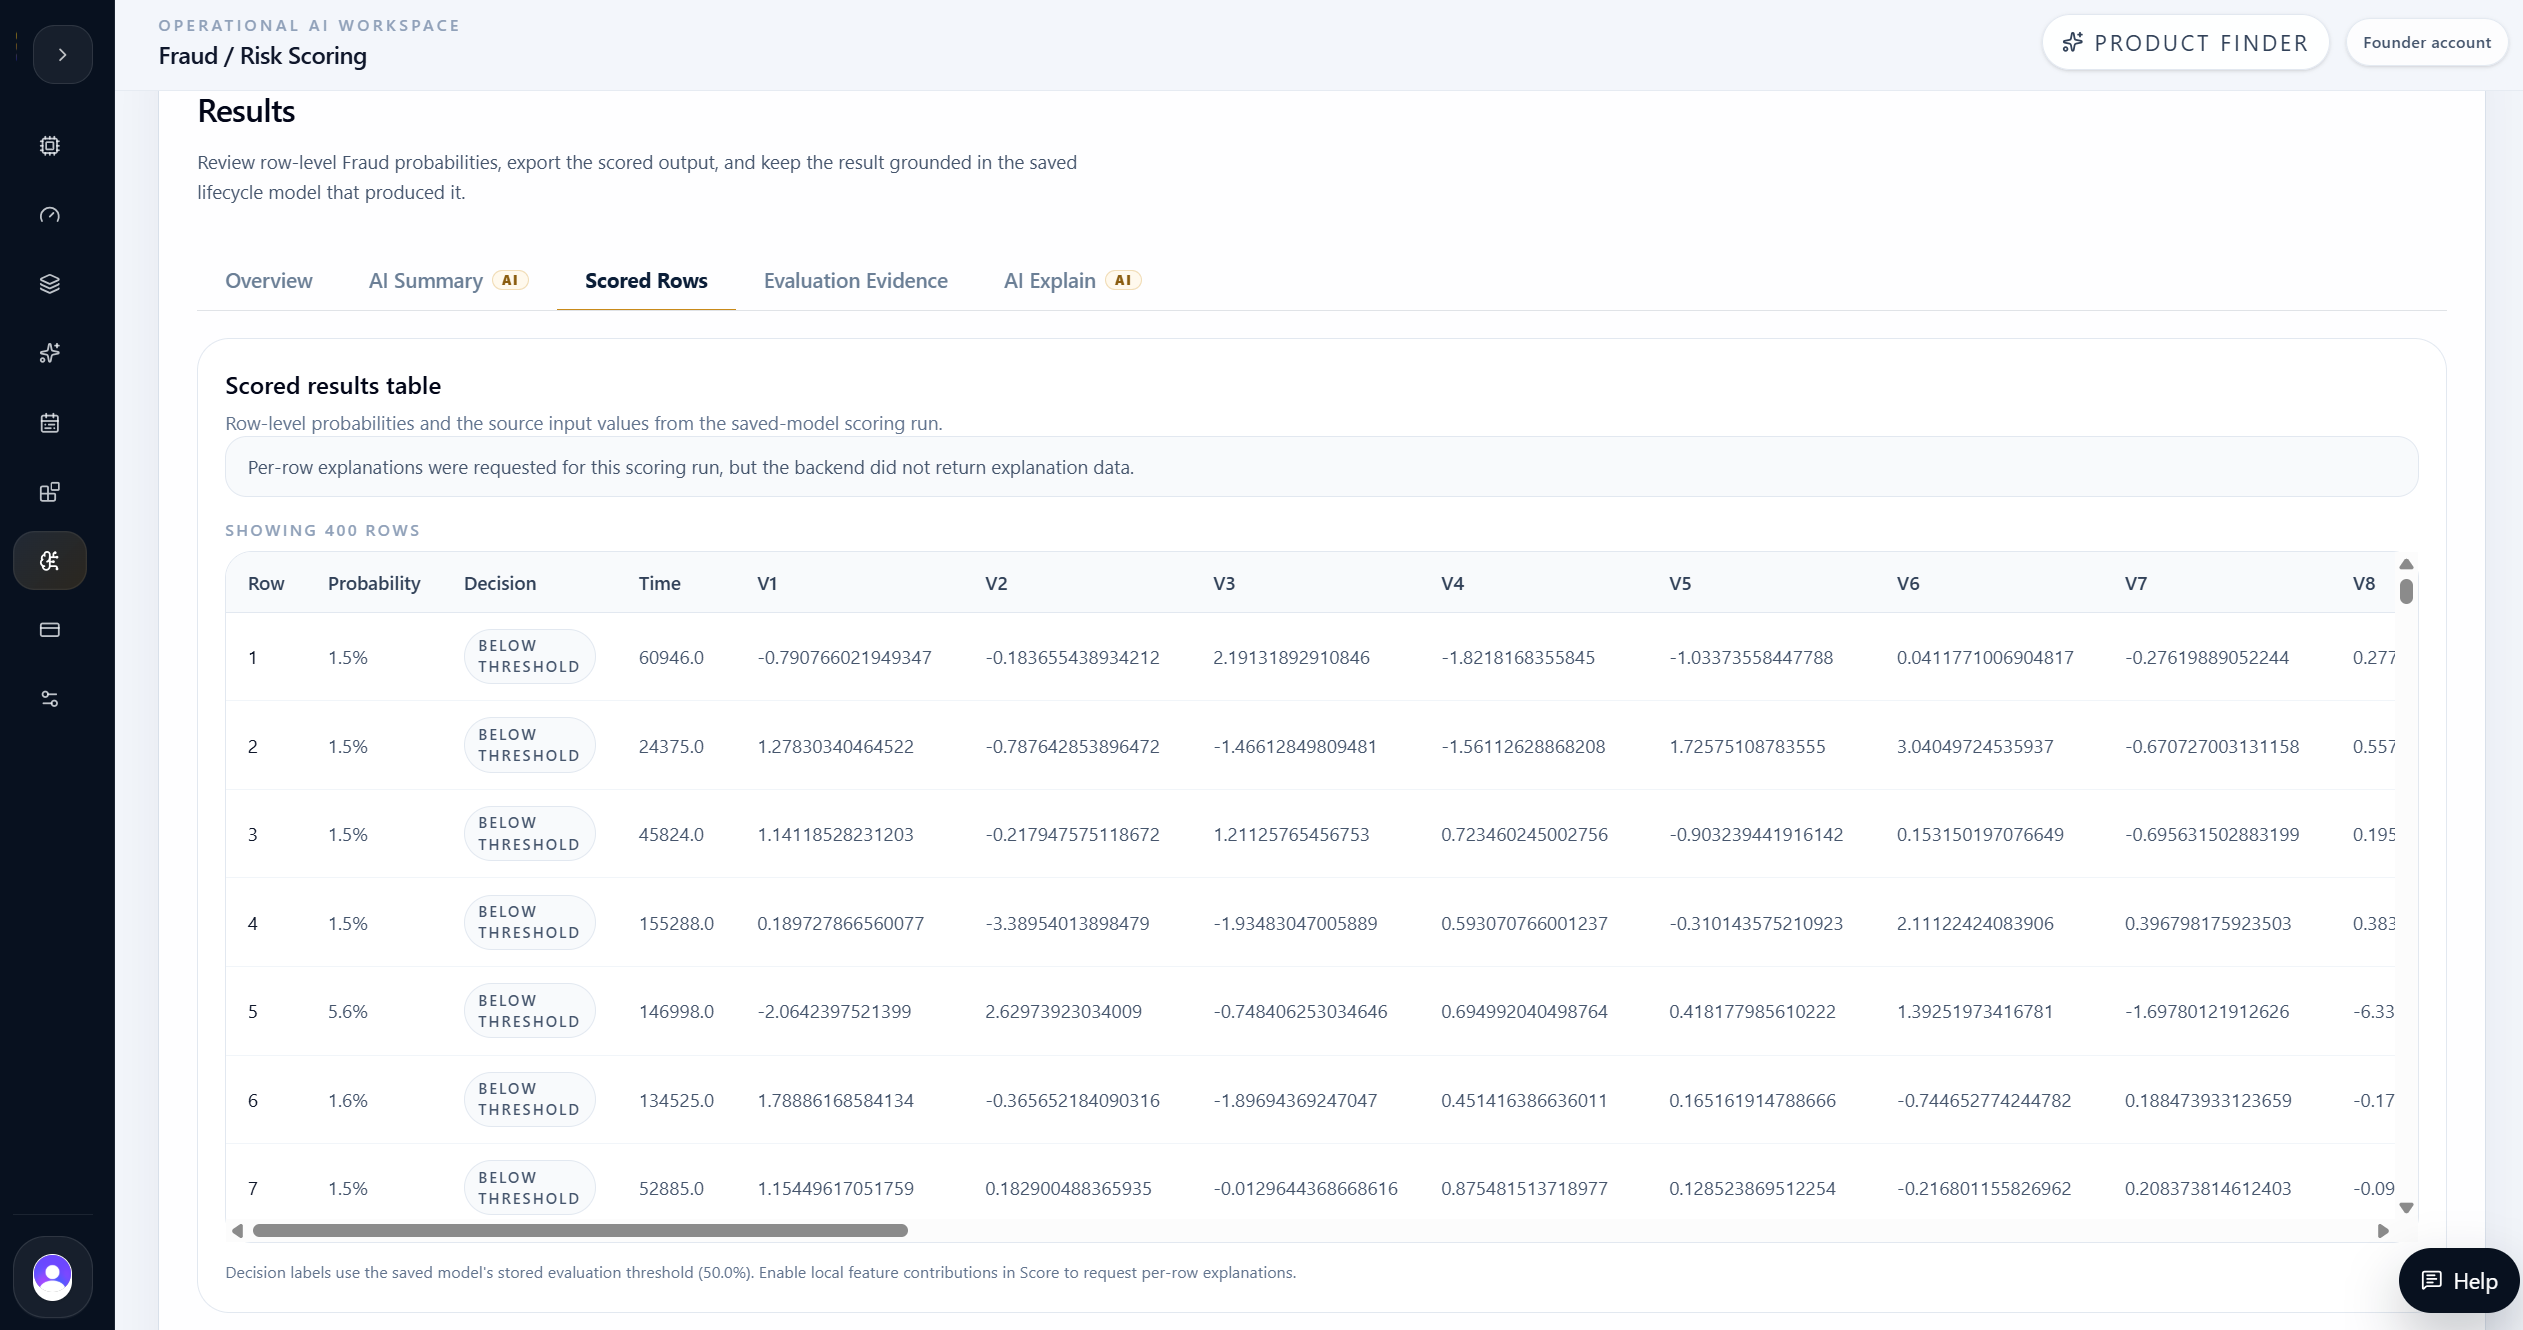
The scoring run used the staged saved model and preserved model provenance. The run produced a probability for each transaction, a decision label based on the stored reference threshold, and a saved scoring result that could be reopened later.
Local row-level feature contributions were requested during scoring, but the backend did not return per-row explanations for this run. The report therefore uses global feature importance and evaluation evidence rather than inventing row-level causal explanations.
| Scoring KPI | Value |
|---|---|
| Rows scored | 400 |
| Average predicted fraud probability | 9.01% |
| Maximum predicted fraud probability | 95.57% |
| Execution source | Active saved XGBoost model |
| Decision threshold | 50.0% reference threshold |
| Local row explanations | Requested but not returned |

Evaluation evidence
The evidence screen translated model metrics into review workload and operating risk.
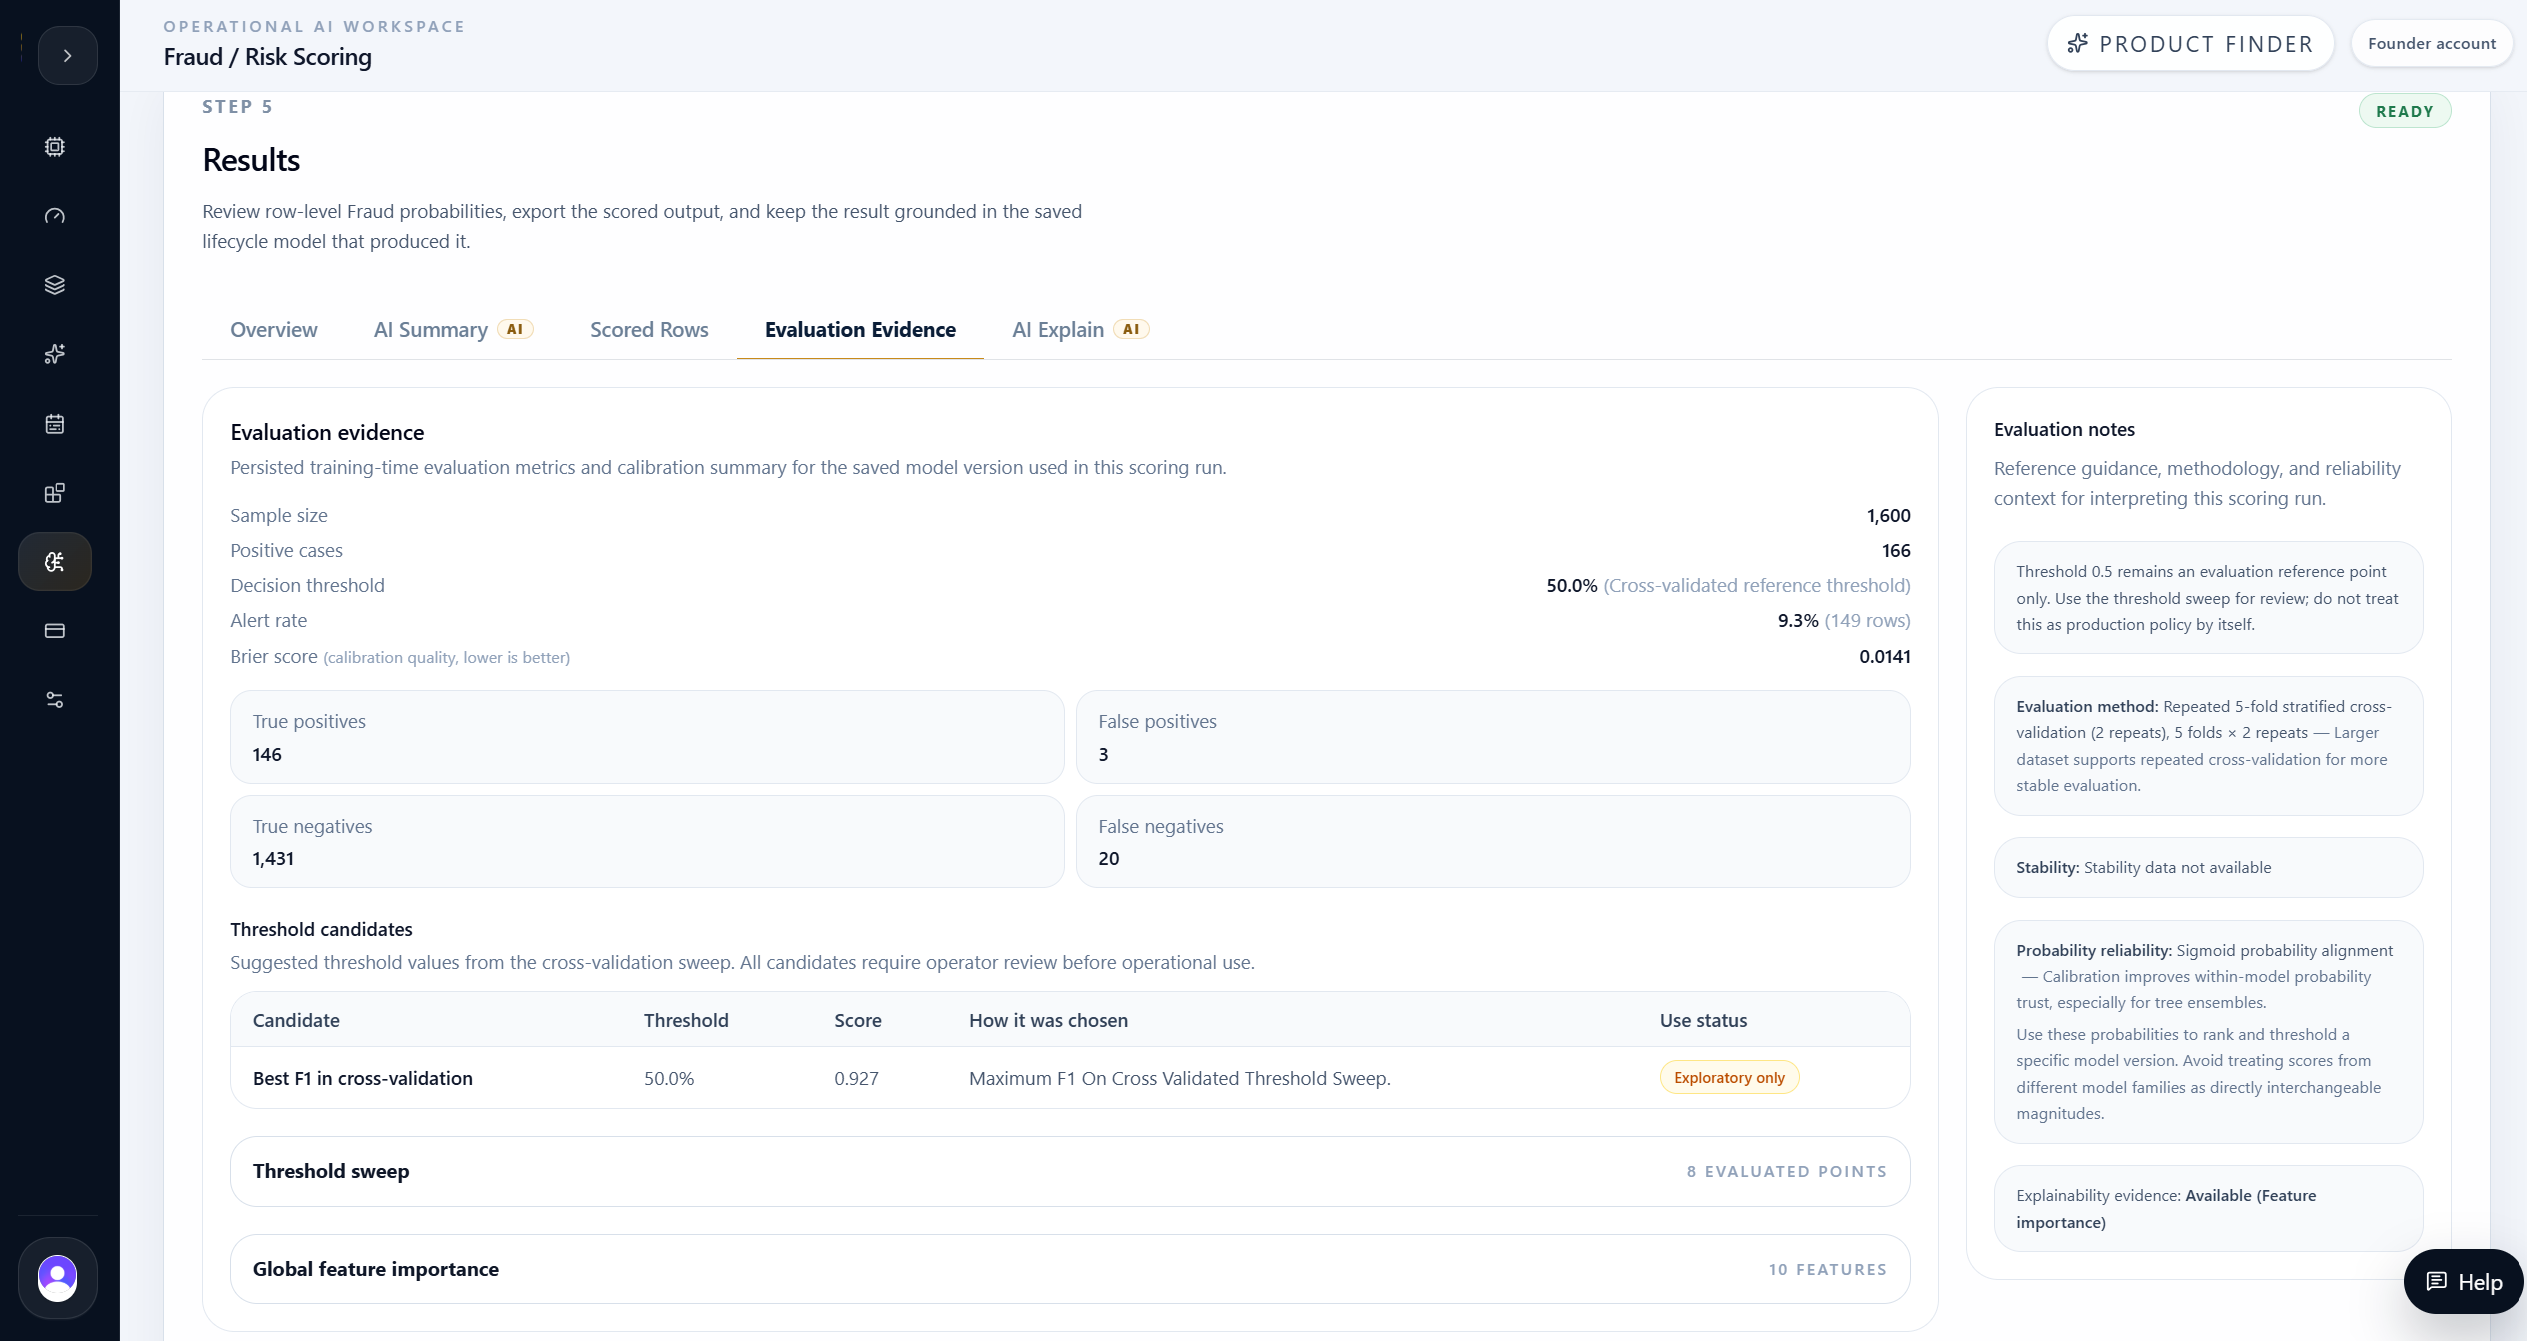
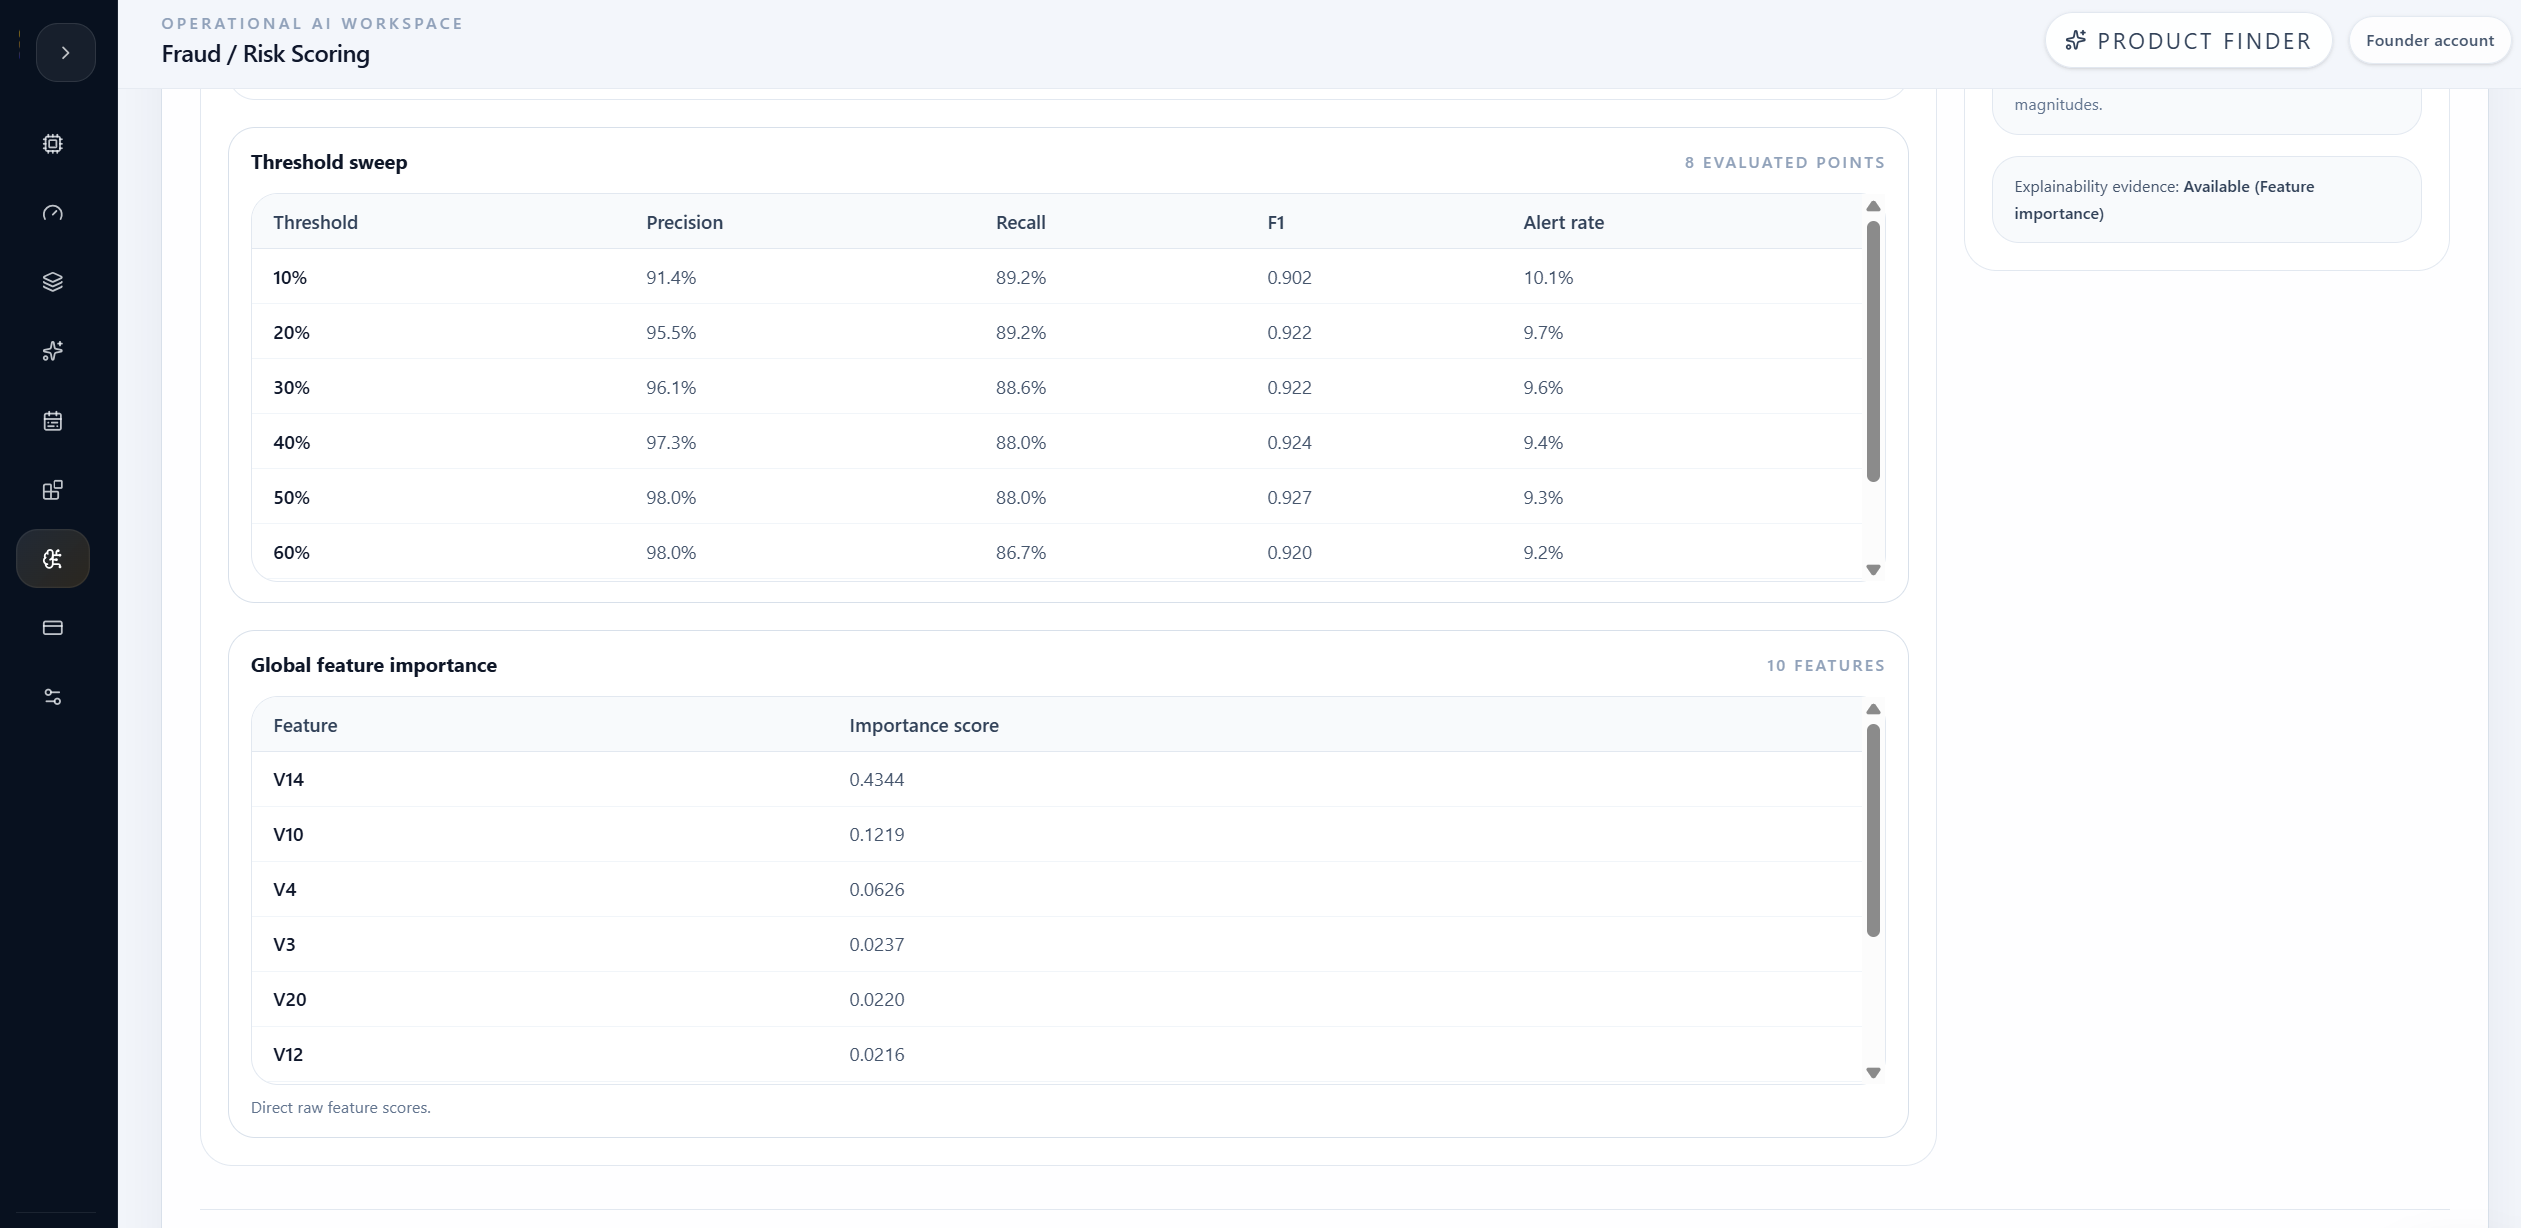
The Evaluation Evidence tab translated model quality into operating terms. At the 0.5 threshold, the saved XGBoost model produced 146 true positives, 3 false positives, 1,431 true negatives, and 20 false negatives on the evaluation sample.
The alert rate was 9.3%, equal to 149 rows in the evaluation evidence. That is important because alert rate is the review workload a fraud operations team would need to absorb if it used that reference threshold.
The model used sigmoid probability alignment and reported a Brier score of 0.0141. The product correctly framed this as probability reliability within the model, while warning that raw scores from different calibrated and uncalibrated model families should not be treated as directly interchangeable.
| Evidence | Value |
|---|---|
| Evaluation sample | 1,600 rows |
| Positive cases | 166 |
| Decision threshold | 50.0% |
| Alert rate | 9.3% / 149 rows |
| True positives | 146 |
| False positives | 3 |
| True negatives | 1,431 |
| False negatives | 20 |
| Brier score | 0.0141 |
AI Summary and AI Explain
AI turned scoring evidence into an operations-ready interpretation.
AI Summary gave a concise readout of the scoring result: 400 rows scored, average predicted fraud probability of 0.0901, maximum score of 0.9557, and XGBoost v3 as the active saved model. It also preserved the right caveat: row-level local explanations were not returned, although global feature importance was available.
AI Explain then answered the operations question directly. It connected the 0.5 threshold to an estimated 9.3% alert rate, explained the false-positive and false-negative burden, and recommended that the highest-score transactions should receive review priority.
The answer did not overclaim. It treated the threshold as an evaluation reference point, not a production policy. It also warned that the team should validate stability and operating threshold choices before broad deployment.


Operating decision
The team used XGBoost to prioritize card-risk review, with threshold policy still subject to pilot validation.
The team staged XGBoost and used it to score the 400-row card-risk batch. The decision was evidence-led: XGBoost reduced false positives sharply while preserving strong F1 and acceptable recall for this case.
The final operational signal was clear. At the reference threshold, the model concentrates review effort on a manageable share of cases while keeping false positives low. The remaining risk is missed fraud, so the threshold and review policy still need pilot validation before production use.
This is the value of Fraud Detection inside MAG OptiAI. It turns a labeled transaction dataset into a governed model-selection and scoring workflow: train candidates, compare saved evidence, stage the practical model, score unlabeled rows, and use AI to explain the result in operational language.
Final takeaway
The strongest fraud story was not that XGBoost is always better. The product showed how a team can compare trade-offs and stage the model that fits the current operating goal.
For this case, XGBoost gave the cleanest review-workload profile while preserving enough fraud capture to justify a pilot scoring workflow.
Fraud model selection requires trade-off review, not only top-line metrics.
False positives and false negatives must both be visible before staging.
XGBoost was staged because it gave the best balanced candidate profile in this case.
The 0.5 threshold is an evaluation reference point, not a production policy by itself.
AI Summary and AI Explain made the scoring result reviewable without hiding its cautions.